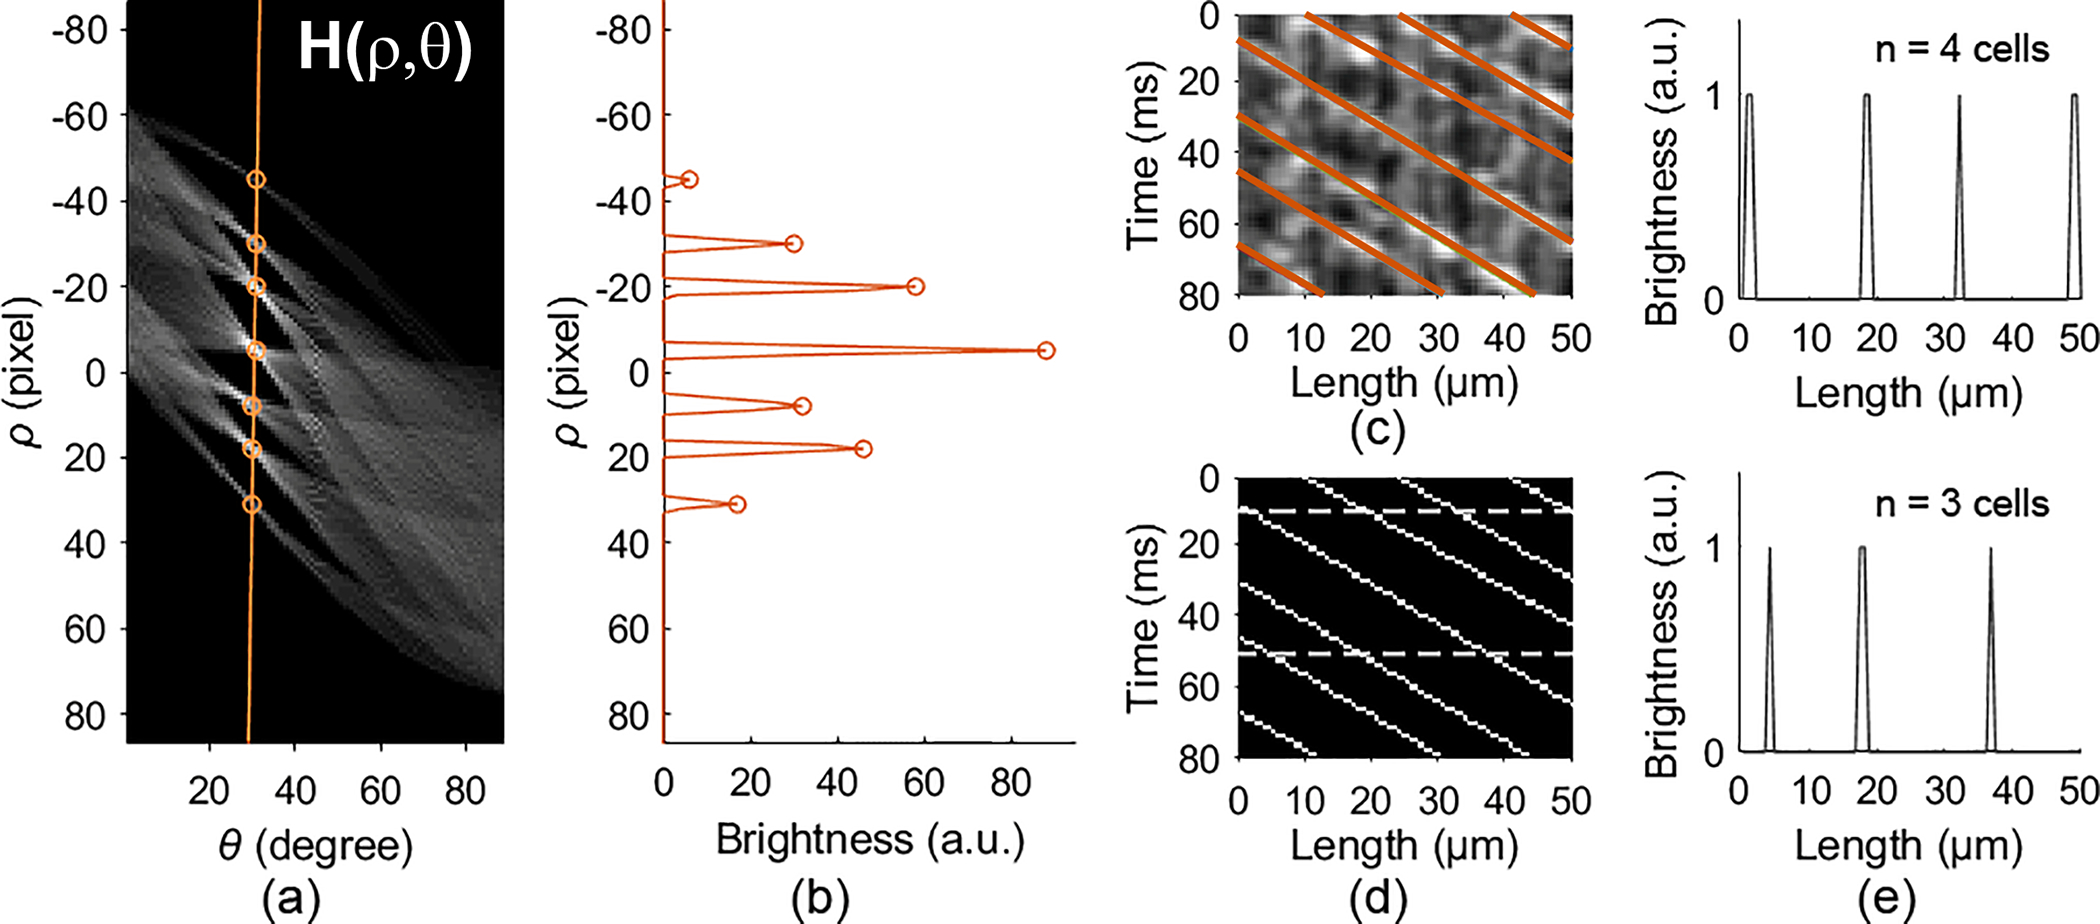
Fig. 3.

RBC spatiotemporal trace detection. (a) The Hough transform of the binarized RBC trace image. (b) The local maximums on the orange line in (a) that correspond to the RBC traces. (c) RBC traces detected by the location of the local maximums in (a) & (b). (d) Skeleton RBC traces. (e) The number of red blood cells counted at 2 time points, 10 ms and 50 ms, indicated by the dashed lines in panel (d). See Code and the testing image.
