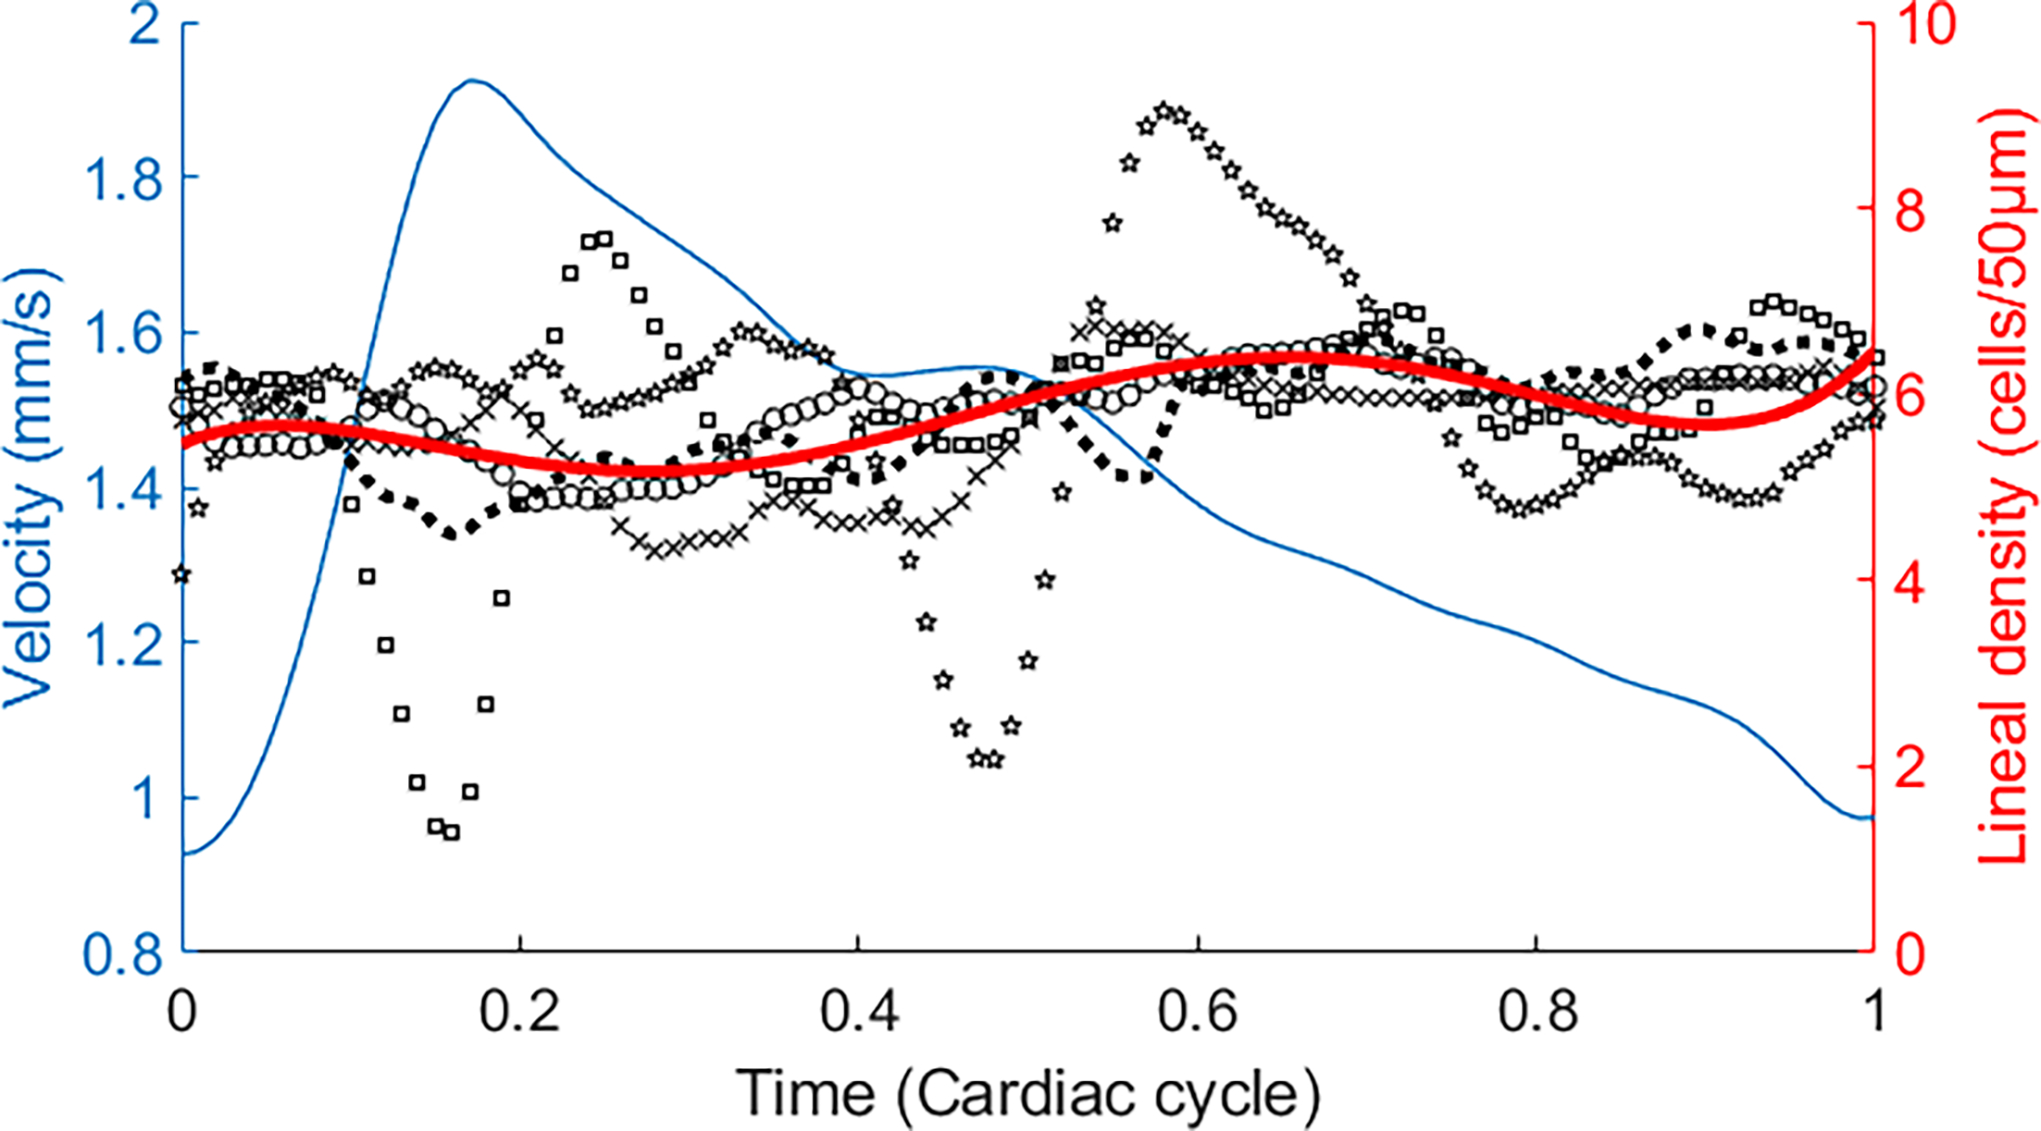
Fig. 4.

RBC lineal density within a cardiac circle in a capillary. Black markers are RBC lineal density measured in different cardiac cycles. Red line is the average RBC lineal density over 5 cardiac circles. Blue line is the average RBC velocity. The plots were drawn in the following steps. 1) The RBC velocity and lineal density were measured in all cardiac cycles. 2) The periods of all cardiac cycles were normalized to 1. 3) RBC velocity and lineal density at the corresponding time points within the normalized cycle were averaged. The cardiac cycle was determined by the simultaneously recorded cardiac pulses. See Data File 1 for underlying values.
