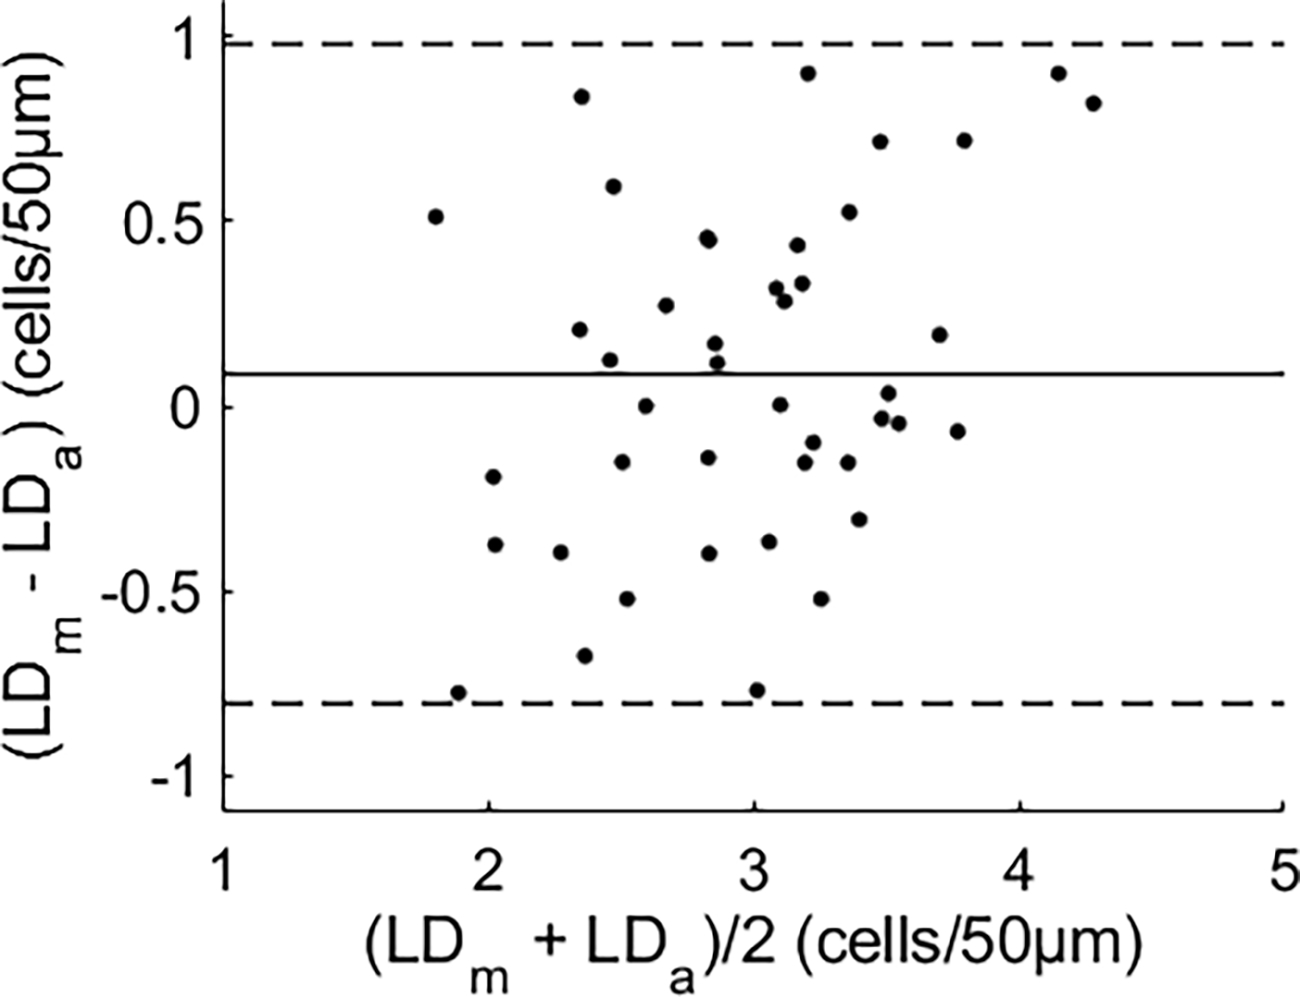
Fig. 5.

Bland-Altman plot [22] of RBC lineal density measured by manual counting (LDm) versus that by the automated algorithm (LDa). The solid line is the mean difference of the two measurements. Dashed lines indicate the 95% confidence interval (mean ± 1.96 × standard deviation). See Data File 2 for underlying values.
