Figure 3.
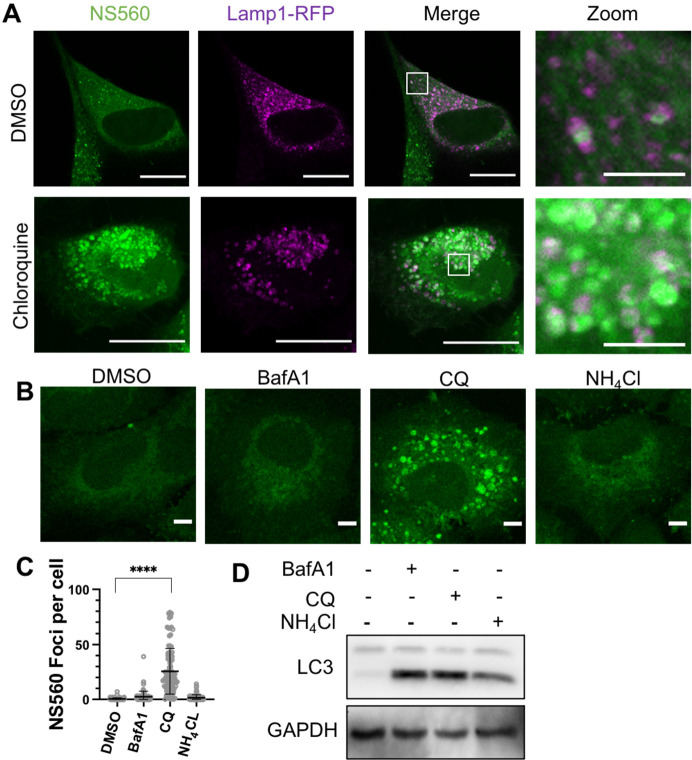
Chloroquine treatment alters amino acid pools in A549 cells. (A) Five-hour chloroquine treatment at 100 μM causes drastic buildup in lysosomal amino acid labeling. Scale bars, 20 or 4 μm (for zoom-in images). (B) A549 cells treated with BafA1 (25 nM), CQ (25 μM), and NH4Cl (25 mM) for 7 h. Representative images of three biological replicates. Scale bar, 5 μm. (C) Representative quantification of NS560 foci in cells treated with different small molecules. (D) Western blot analysis of cells treated in B to detect LC3 levels (autophagy). GAPDH was used as loading control. Representative images are from three independent biological replicates.

