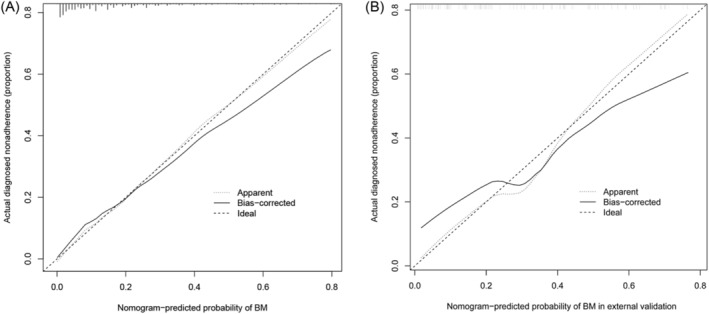
FIGURE 5.

Calibration curves of the nomogram for predicting brain metastases (BM) in small cell lung cancer (SCLC) patients. The x‐axis and y‐axis represent the predicted BM and the actually diagnosed BM, respectively. The diagonal dotted line represents a perfect prediction of an ideal model. The solid line represents the performance of the nomogram, where closer proximity to the diagonal dashed line indicates a better prediction. (A) The training cohort, (B) the external validation cohort.
