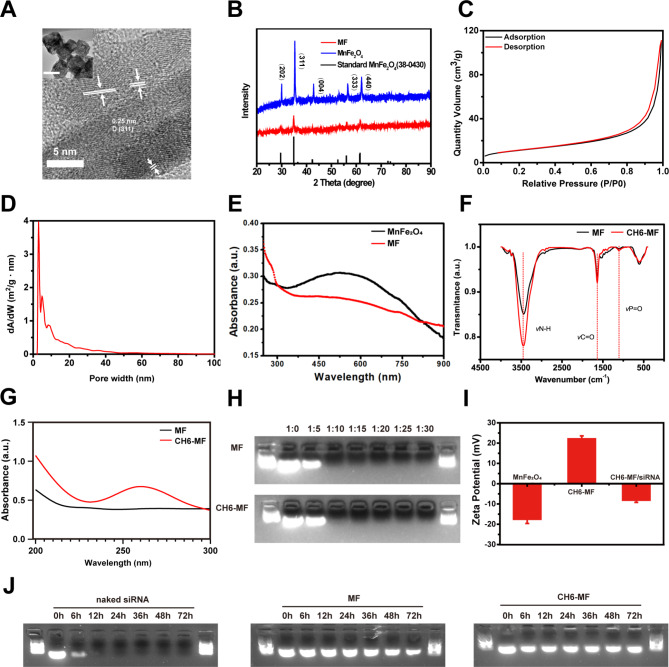
Fig. 1.
Characterization of MF NPs and CH6-MF NPs. (A) HRTEM image of synthesized MnFe2O4 NPs. The NPs exhibited a large number of surface defects with a twisted lattice, dislocations and distortions (inset: TEM image of synthesized MnFe2O4 nanoparticles, scale bar = 100 nm). (B) XRD spectrum of synthesized MnFe2O4 nanoparticles, MF NPs, and tetragonal standard MnFe2O4. (C) N2 adsorption/desorption isotherms of synthesized MnFe2O4 NPs. (D) Pore size distribution of synthesized MnFe2O4 NPs with abundant surface defects. (E) UV–vis spectra of synthesized MnFe2O4 NPs and MF NPs. (F) FTIR spectra of MF NPs and CH6-MF NPs. (G) UV–vis spectra of MF NPs and CH6-MF NPs from 200 to 300 nm. (H) Agarose gel electrophoresis (110 V, 5 min) of NP-siRNA complexes at different weight ratios. (I) Zeta potential variations of synthesized MnFe2O4 NPs, CH6-MF NPs and CH6-MF NPs/siRNA. (J) siRNA serum stability of naked siRNA, MF NPs/siRNA and CH6-MF NPs/siRNA complexes(NP:siRNA weight ratio of 10:1) incubated with fetal bovine serum(50% final concentration) at 37 °C for different times. Data were analysed by Student’s t test and one-way ANOVA. The outcomes are presented as the mean ± Sd. ns = statistically nonsignificant, *P < 0.05, **P < 0.01, and ***P < 0.001; n = 3

