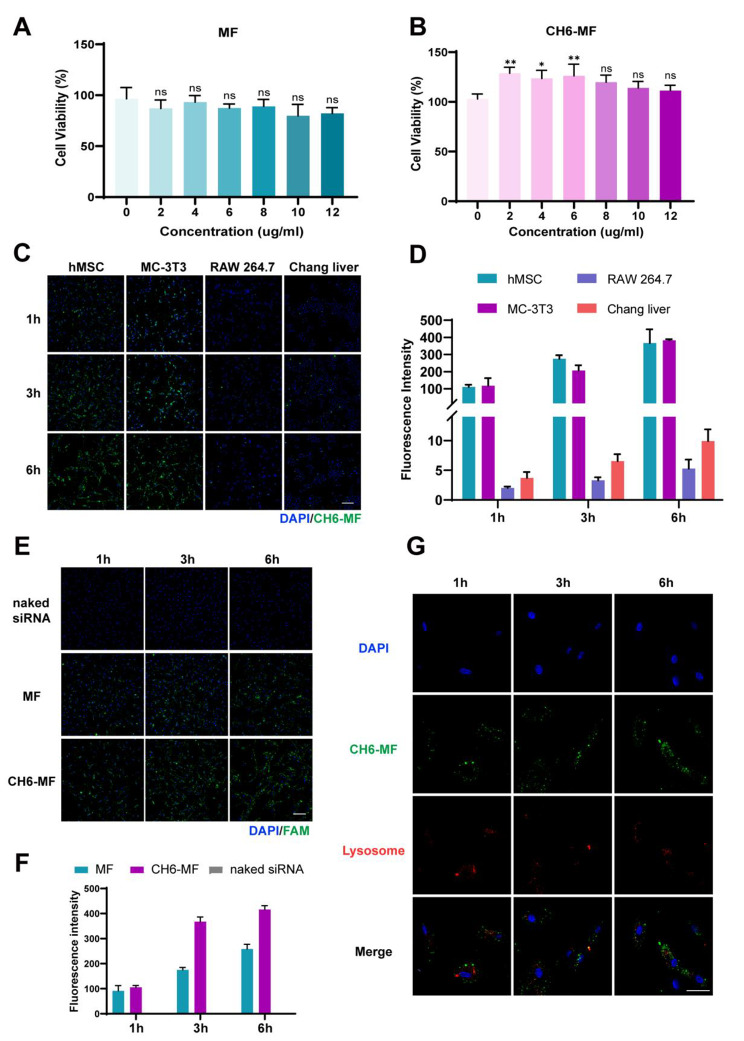
Fig. 3.
Cell viability and distribution of the nanoparticles in vitro. Viability of hMSCs after treatment with (A) MF NPs and (B) CH6-MF NPs at different concentrations for 3 days. (C) Cellular uptake of CH6-MF NPs/FAM-labelled siRNA (green) in hMSCs, MC-3T3 cells, RAW264.7 cells and Chang liver cells at different time points. The nuclei were stained with DAPI (blue). (D) Quantification of the fluorescence intensity in (C). (E) Cellular uptake of naked FAM-labelled siRNA, MF NPs/FAM-labelled siRNA and CH6-MF NPs/FAM-labelled siRNA in hMSCs at different time points, and the nuclei were stained with DAPI (blue). (F) Quantification of the fluorescence intensity of (E). (G) Immunofluorescence stain for CH6-MF NPs/FAM-labelled siRNA (green) and lysosomes (red) by confocal laser scanning microscopy to track the intracellular fate of CH6-MF NPs, and the nuclei were stained with DAPI (blue). Data were analysed using one-way ANOVA. The outcomes are presented as the mean ± SD. ns = statistically nonsignificant, *P < 0.05, **P < 0.01, and ***P < 0.001; n = 3. (C) and (E) Scale bar = 200 μm. (G) Scale bar = 100 μm

