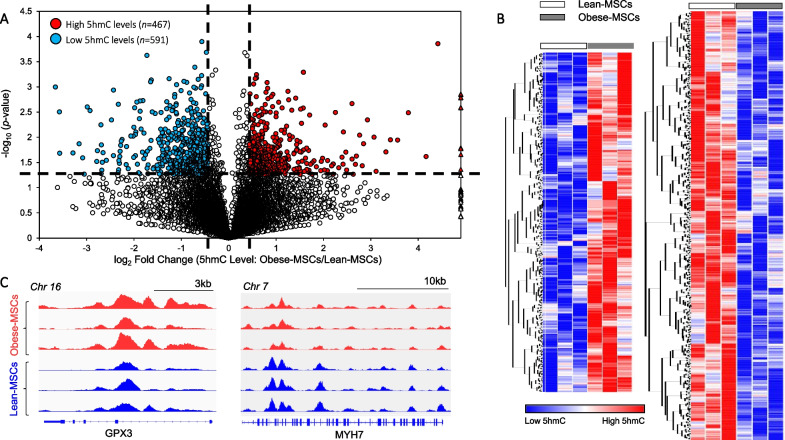
Fig. 2.
Obesity and dyslipidemia induce epigenetic changes in 5-hydroxymethylcytosine (5hmC) in swine adipose-derived MSCs. A Volcano plot of genes with significant changes in overall exonic 5hmC peak levels in Obese-MSCs versus Lean-MSCs, as defined by the following thresholds (dashed lines): p-value ≤ 0.05 and fold change (Obese-MSCs/Lean-MSCs) ≥ 1.4 (high 5hmC levels) or ≤ 0.7 (low 5hmC levels). Genes with high (n = 467) or low (n = 591) 5hmC levels in Obese- versus Lean-MSCs are represented with red or blue circles, respectively, while blank circles indicate genes without significant alterations. Outlier genes with very large fold change values (often due to undetectable 5hmC levels in Lean-MSCs) are displayed as triangles. B Heat map of genes with higher (left) or lower (right) 5hmC levels in Obese-MSCs versus Lean-MSCs. C Integrative Genomics Viewer (IGV) outputs displaying 5hmC profiles for two representative genes. n = 3 per group

