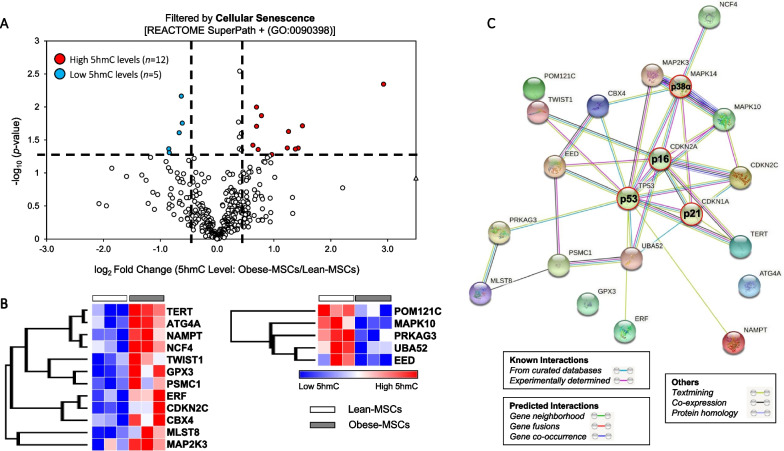
Fig. 5.
Cellular senescence-associated genes with differential 5hmC levels in swine Obese- versus Lean-MSCs interact richly with canonical markers of senescence. A Volcano plot showing differential 5hmC levels in Obese- versus Lean-MSCs for genes filtered by the Cellular Senescence REACTOME Superpath or the GO term for Cellular Senescence (GO:0090398). For a given gene, differential 5hmC levels entail p-value ≤ 0.05 and fold change (Obese-MSCs/ Lean-MSCs) ≥ 1.4 (high 5hmC) or ≤ 0.7 (low 5hmC), as shown with dashed lines. Senescence-associated genes with high (n = 12) or low (n = 5) 5hmC levels in Obese- versus Lean-MSCs are represented with red or blue markers, respectively. B Heat map of genes filtered for Cellular Senescence showing higher (left) or lower (right) 5hmC levels in Obese-MSCs versus Lean-MSCs. C Functional network analysis of genes with differential 5hmC levels in Obese- versus Lean-MSCs using the STRING database. Network edges indicate both functional and physical protein associations, and color indicates the type of interaction evidence. Inclusion of three classic markers of senescence (p16, p21, and p53), along with stress kinase p38α, in the interaction analysis reveals salient interactions with the epigenetically dysregulated genes

