
Figure 2.
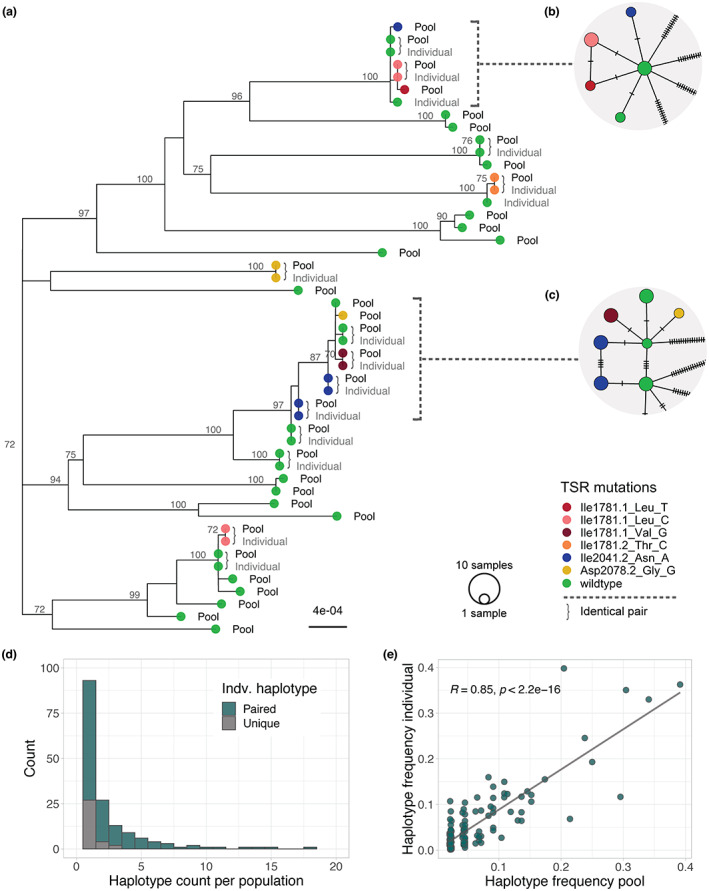
Unique ACCase haplotypes identified by pbaa in individuals compared to pools for the same population. (a) Maximum‐likelihood tree of haplotypes identified in the pool data set (200 samples), and haplotypes inferred in the individual data set (24 samples). Samples were collected in an agricultural field in Belgium (BE01585). For simplicity, in the individual data set, only unique haplotypes are shown. Tree labels indicate the data set of origin (Pool vs. Individual). Coloured tree tips show target‐site‐resistance (TSR) mutations. Curly brackets mark identical haplotype pairs found in both the individual and the pool data set from the same population. (b, c) Haplotype network representing the corresponding clade in the tree. pbaa can successfully recover haplotypes that differ only in one mutation (tick bar). (d) Haplotype counts per population in the individual data set. The number of haplotypes that could have been successfully identified in the pool data set is marked in green. Only a fraction of the low abundant ones could not be recovered (grey). (e) Correlation of haplotype frequencies in the pool data set versus the individual data set.