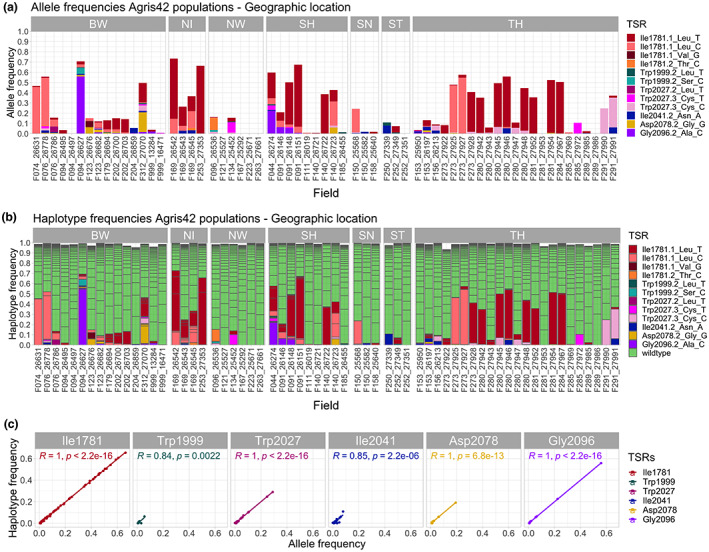
Figure 3.

Comparison between conventional single‐nucleotide polymorphism (SNP) mapping and pbaa haplotype clustering. (a) TSR allele frequencies obtained by SNP mapping. Colours indicate different TSR mutations. (b) Haplotype frequencies were inferred using pbaa (Kronenberg et al., 2021). Colours refer to TSR and wild‐type haplotypes. (c) Correlation between allele frequencies and haplotype frequencies summarized per TSR amino acid position. Correlation coefficients and P values are shown separately in each TSR panel. BW, Baden‐Württemberg; NI, Lower Saxony; NW, North Rhine‐Westphalia; SH, Schleswig‐Holstein; SN, Saxony; ST, Saxony‐Anhalt; TH, Thuringia.
