Fig. 7.
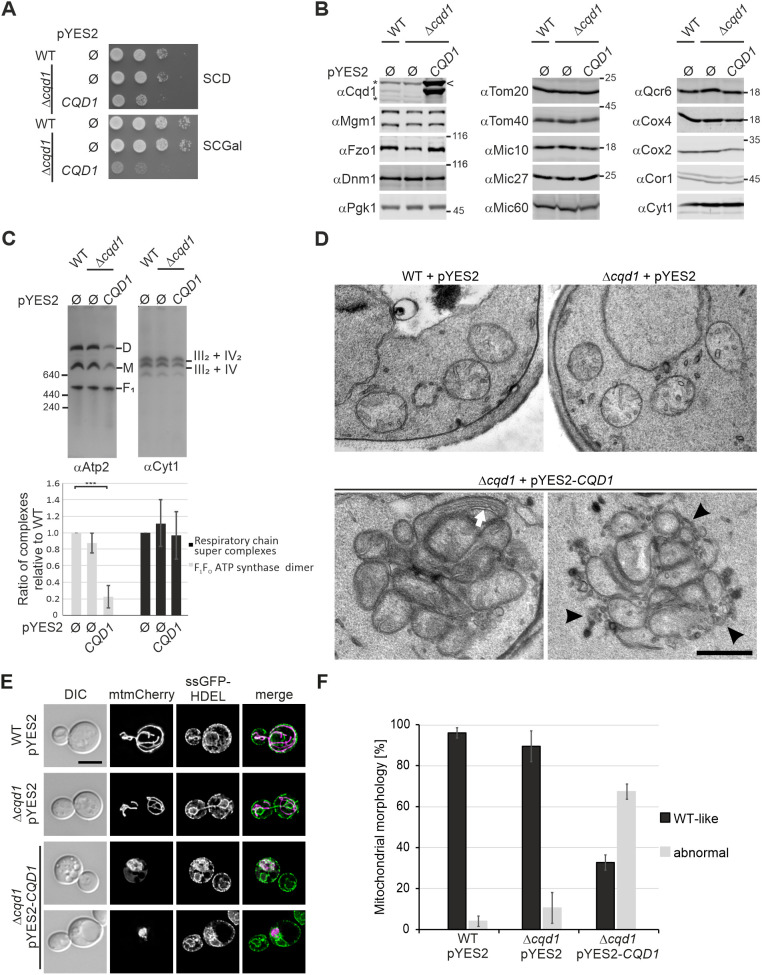
Overexpression of CQD1 leads to dramatic changes in architecture and morphology of mitochondria. (A) Overexpression of CQD1 is toxic. Wild-type and Δcqd1 cells carrying an empty vector (pYES2 Ø) and Δcqd1 cells expressing CQD1 from a high-copy plasmid with a galactose-inducible promoter (pYES2-CQD1) were grown in SCD and shifted to SCGal prior to analysis. (B) Deletion or overexpression of CQD1 does not affect steady-state levels of mitochondrial proteins. Whole-cell extracts of wild-type and yeast cells in which CQD1 was deleted or overexpressed were analyzed by immunoblotting. Asterisks indicate cross reactions of the anti-Cqd1 antibody. The arrowhead indicates the potential precursor form of Cqd1. (C) Overexpression of Cqd1 results in strongly reduced levels of assembled F1FO ATP synthase. Isolated mitochondria of cells grown in SCGal were lysed in buffer containing digitonin (3% w/v) and cleared lysates were subjected to BN-PAGE. The assembly of the F1FO ATP synthase or the respiratory chain super complexes was analyzed by immunoblotting using antibodies against Atp2 or Cyt1. D, dimer of the F1FO ATP synthase; M, monomer of the F1FO ATP synthase; F1, F1 subcomplex of the F1FO ATP synthase. Upper panel, immunoblot for one representative experiment. Lower panel, quantification of signal intensities of the F1FO ATP synthase dimers and the respiratory chain super complexes [complex III dimer–complex IV monomer (III2–IV) and complex III dimer–complex IV dimer (III2-IV2)] present in the indicated strains of three biological replicates as determined by Image J software. Error bars indicate s.d. ***P≤0.001 (one-way ANOVA with subsequent Tukey's multiple comparison test). (D) Overexpression of CQD1 results in highly altered mitochondrial architecture. Cells were grown overnight in SCGal, subjected to chemical fixation with glutaraldehyde and osmium tetroxide, embedded in Epon, and ultrathin sections were analyzed by transmission electron microscopy. The white arrow highlights elongated inner membrane structures; black arrowheads highlight membranes presumably representing cross-sections of ER tubules. Scale bar: 500 nm. Additional electron micrographs are shown in Fig. S2. (E) Overexpression of CQD1 leads to the formation of mitochondria–ER clusters. Strains expressing mitochondria-targeted mCherry (mtmCherry) and ER-targeted GFP (ssGFP-HDEL) were grown to logarithmic growth phase in SCGal, fixed with formaldehyde, and examined by deconvolution fluorescence microscopy. Shown are maximum intensity projections of z stacks of entire cells (mitochondria) or of the center of the cells (ER, four consecutive z sections). DIC, differential interference contrast. Scale bar: 5 μm. (F) Strains expressing mitochondria-targeted GFP were analyzed as in E and mitochondrial morphology was quantified. Columns represent mean±s.d. values from two independent experiments with three biological replicates per strain and at least 150 cells per replicate. Representative images are shown in Fig. S3. Images in B and D are representative of at least three repeats.

