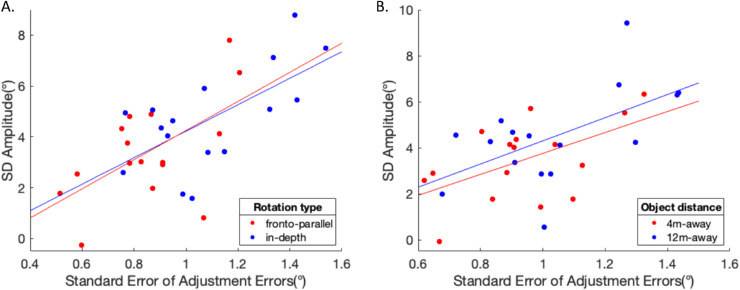
Figure 4.
(A) Amplitude of DoG curves as a function of response scatter (i.e. standard error of adjustment errors) of each individual observer for different rotation types. Each point corresponds to data from one rotation type condition of an individual observer. Red and blue data points are obtained from the frontoparallel and in-depth rotation conditions, respectively. The red and the blue lines are the best fitting linear models for the data from frontoparallel and in-depth rotation conditions, respectively. (B) Amplitude of DoG curves as a function of standard error of adjustment errors made by each individual observer for different object distances. Each point corresponds to data from one distance condition of an individual observer. Red and blue data points are obtained from the 4 m-away and 12 m-away conditions, respectively. The red and the blue lines are the best fitting linear models for the data from the 4 m-away and 12 m-away conditions, respectively.

