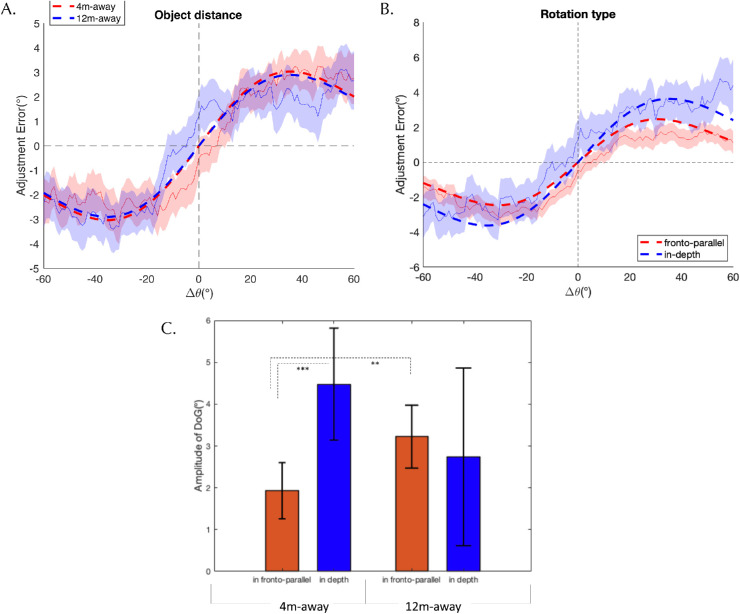
Figure 7.
The results of Experiment 3. Adjustments errors as a function of the orientation difference between the previous and current object. The DoG curves are fitted to the aggregate group data. The thin solid lines show the raw data and the shaded areas denote the 95th percentile of the bootstrapping results. The thick dashed lines indicate the fitted DoG curves. (A) DoG curves for different object distances from the observer. (B) DoG curves for different types of object rotations. (C) The amplitude of the DoG curves for the interaction of the two conditions. Error bars denote the 95th percentile of the bootstrapping results. The number of stars indicate the level of significance between the conditions (*p < 0.05; **p < 0.01; ***p < 0.001).

