Figure 2.

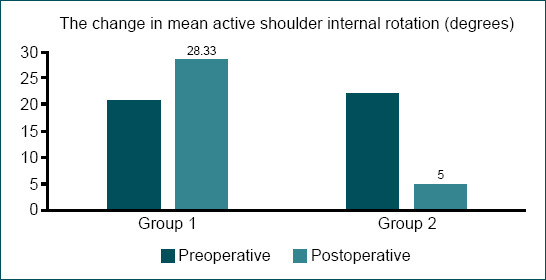
The coloumn graph compares the pre-operative and post-operative mean values of active internal rotation between the groups.

The coloumn graph compares the pre-operative and post-operative mean values of active internal rotation between the groups.