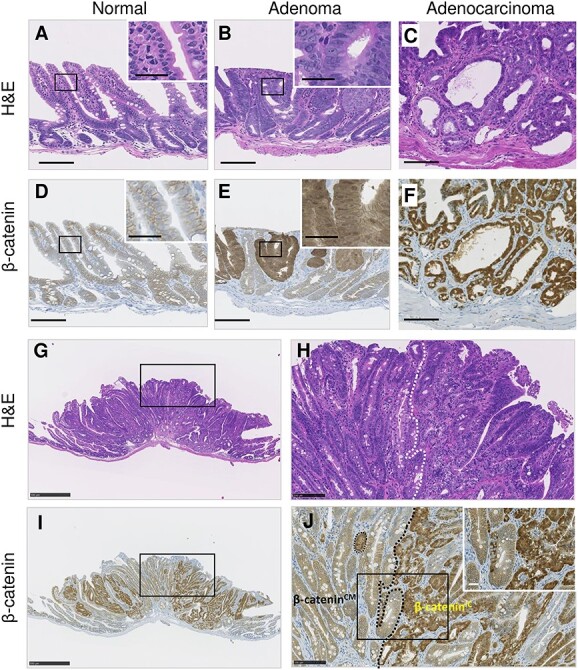
Fig. 1.

Representative histology and β-catenin immunostaining images of normal and neoplastic intestinal FFPE tissues. (A–C, G and H) H&E staining. (D–F, I and J) β-catenin immunostaining. (G–I) Histology of a representative adenocarcinoma. Insets in A–F are magnified views of the rectangles. (H and J) Enlarged images of rectangles in G and I, respectively. The dotted line indicates the boundary between the β-cateninIC and β-cateninCM regions. Scale bars, 100 μm (A–F, H and J), 25 μm (insets) and 500 μm (G and I).
