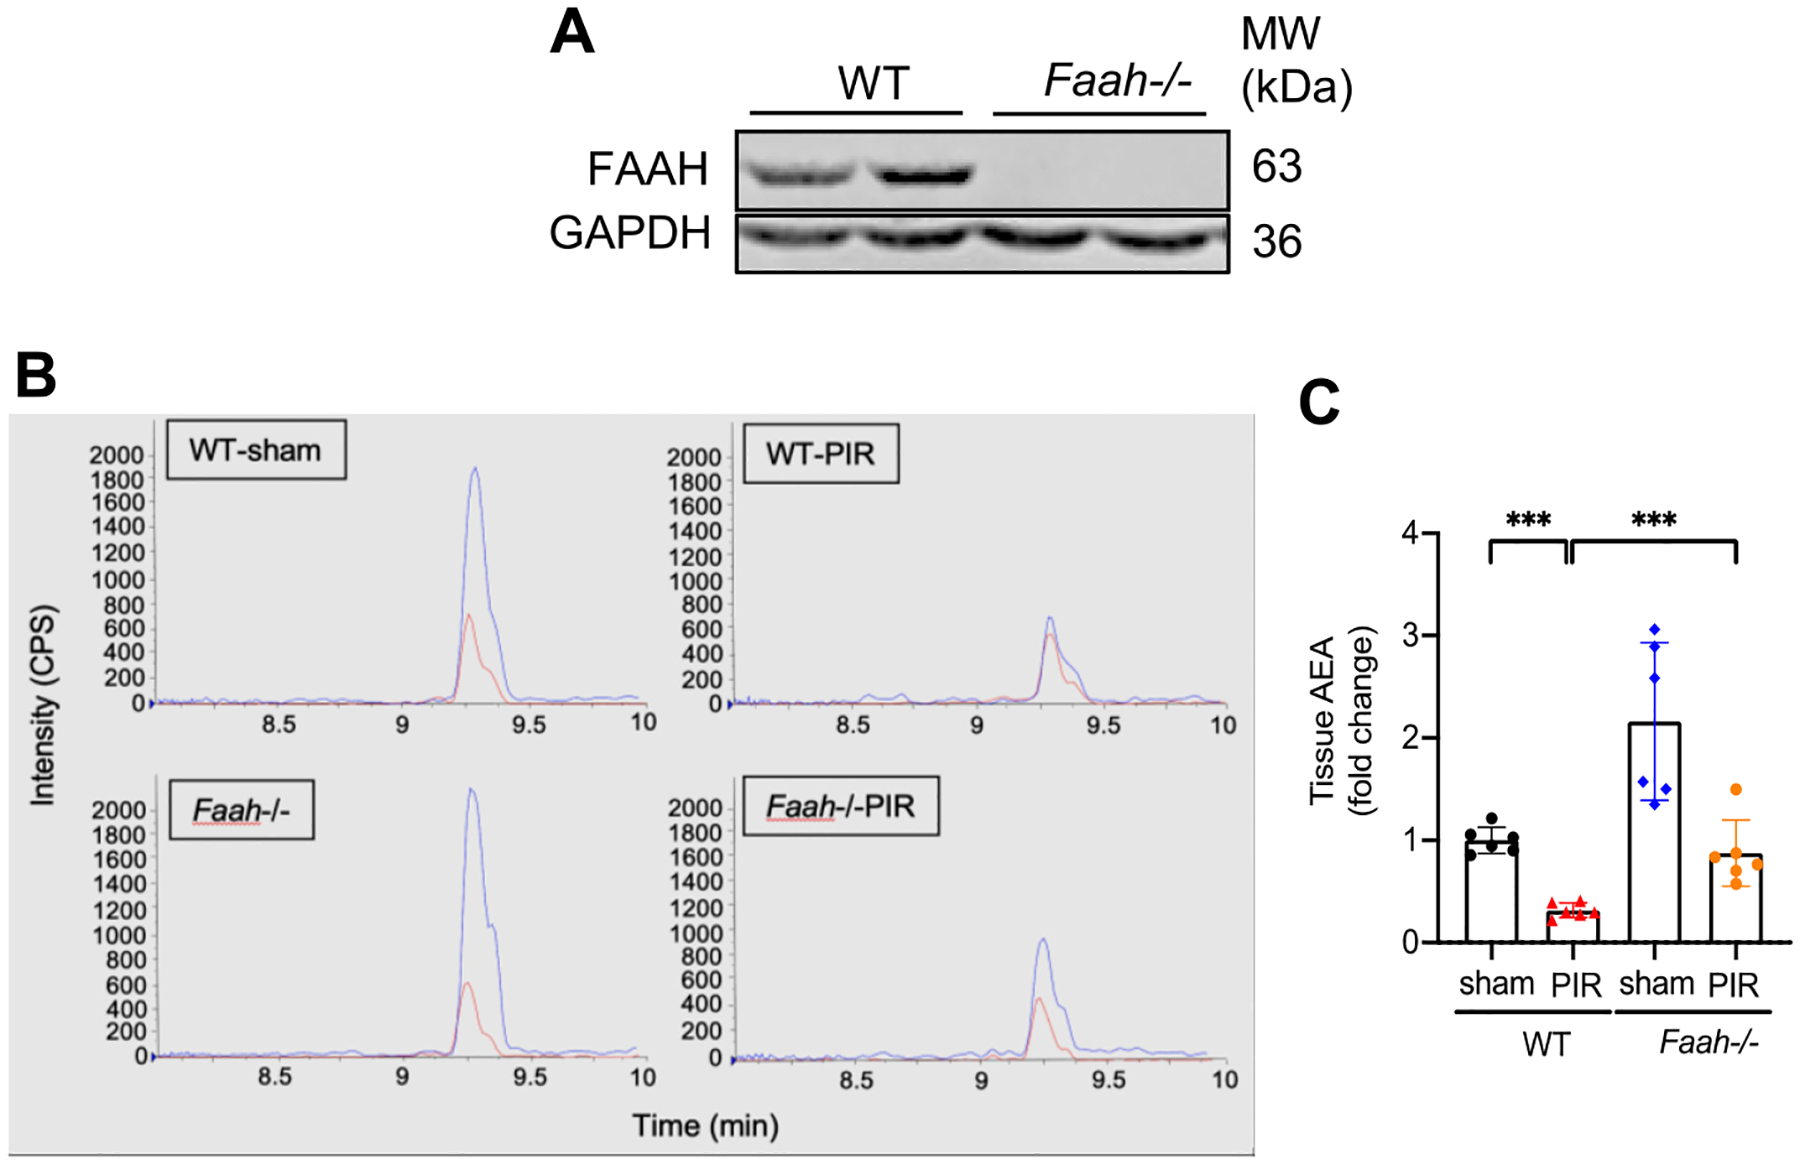
Fig. 2.

Effects of PIR and FAAH KO on levels of AEA in mouse kidneys. (A) Representative immunoblots validating the Faah deletion in mouse kidneys. (B) Representative liquid chromatography/tandem mass spectrometry (LC-MS/MS) chromatograms of tissue AEA extracted from renal cortex. AEA (blue) & AEA-d 8 (red, internal standard) from renal cortex extracts. Y-axis (intensity of AEA, CPS, counts per second) and X-axis (retention time of AEA). (C) Quantitative data (n = 6) showing the relative fold change of AEA. All values were normalized to tissue weight of mouse cortex. *** P < 0.001 by two-way ANOVA Tukey’s multiple comparisons test.
