Figure 1.
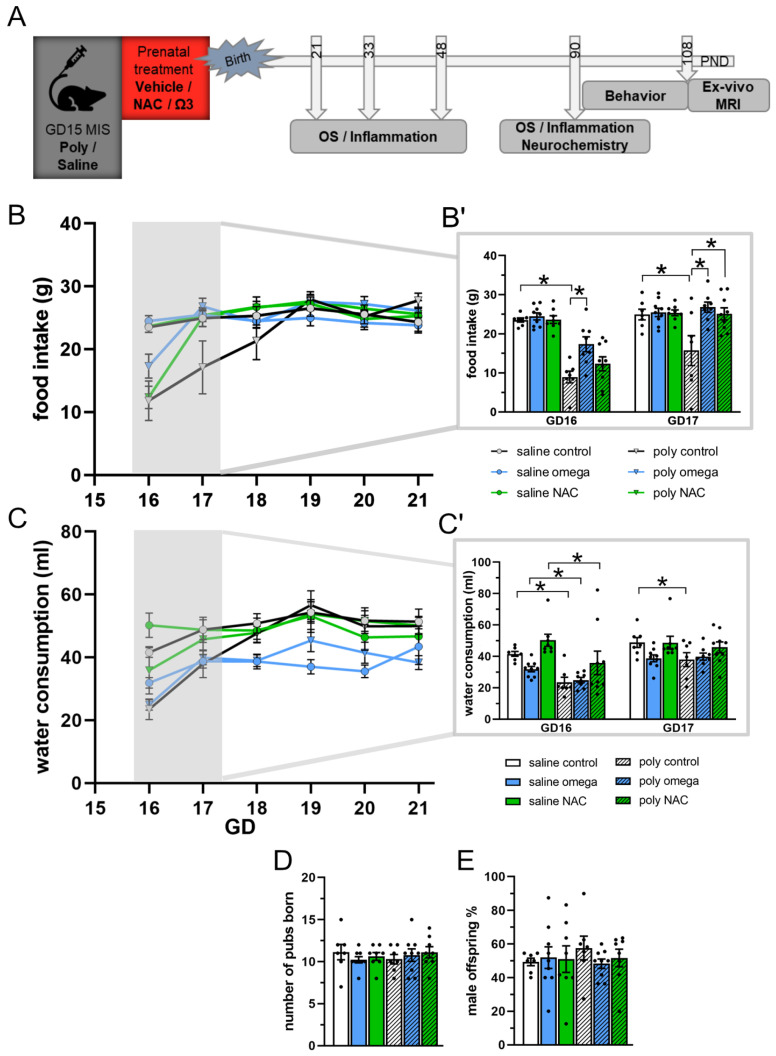
Experimental design and maternal state. (A) Experimental design showing the time points for phenotype induction, prenatal treatment, and subsequent testing of the offspring. (B,B′) Maternal food intake (in grams). At GD16, food consumption was significantly reduced in the dams injected with Poly I:C (post hoc test *, saline control vs. Poly I:C control: p < 0.001), whereas this was less pronounced in Poly I:C animals treated with omega-3 PUFAs (post hoc test *: Poly I:C control vs. Poly I:C omega-3: p < 0.001). At GD17, food consumption had normalized in Poly I:C animals treated with both omega-3 PUFAs and NAC, whereas the Poly: I:C controls continued to display reduced food intake (post hoc test *: saline control vs. Poly I:C control: p = 0.009; Poly I:C control vs. Poly I:C NAC: p = 0.014; Poly I:C control vs. Poly I:C omega-3: p = 0.003). (C,C′) Maternal water intake (in milliliters) after phenotype induction from GD16 to GD21. At GD16, water intake was significantly reduced in all Poly I:C groups following phenotype induction (post hoc test *: all Poly I:C vs. respective saline groups: p < 0.001). At GD17, water intake was restored in Poly I:C animals treated with omega-3 PUFAs and NAC, whereas the Poly I:C controls continued to display reduced water intake (post hoc test *: saline controls vs. Poly I:C controls: p = 0.009). (D) Number of pups born in each experimental group. (E) Percentage of male offspring in each experimental group. B′ shows subimage of figure B, focusing on GD16-17. C′ shows subimage of figure C, focusing on GD16-17 GD: gestational day, PND: postnatal day, OS: oxidative stress, MRI: magnetic resonance imaging, NAC: N-acetyl-cysteine (n; saline: control = 7, omega-3 = 8, NAC = 9; n Poly I:C: control = 7, omega-3 = 8, NAC = 9). Asterisks * indicate significant post hoc tests.

