Figure 2.
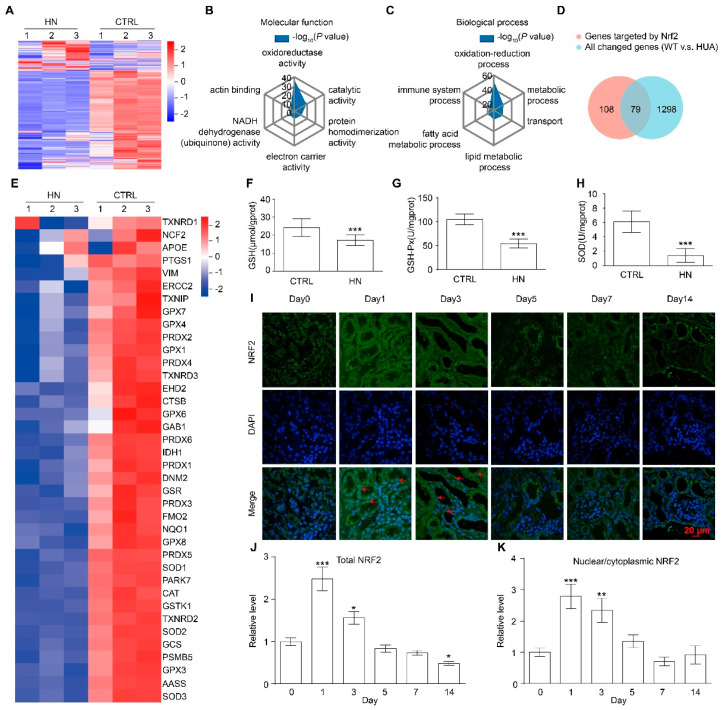
NRF2 signaling pathway is impaired in the kidney of HN mice. (A) Heatmap of gene abundance values from kidneys from CTRL and HN mice. RNA-sequencing analysis was performed with kidneys from three mice of each group. Data for each biological replicate are shown. (B,C) Gene ontology (GO) enrichment analysis of differentially expressed genes (DEGs). (D) Venn diagram from NRF2 target genes and DEGs. (E) Heatmap of the expression of 38 common NRF2 target genes in DEGs. (F) Glutathione (GSH) levels in kidneys in the indicated groups. (G) Glutathione peroxidase (GSH-PX) activity in kidneys in the indicated groups. (H) Superoxide dismutase (SOD) activity in kidneys in the indicated groups. (I) Immunofluorescence staining of NRF2 in kidneys in the indicated groups. Scale bar, 20 μm. Arrows indicate NRF2 nuclear localization. DAPI, 4’,6-diamidino-2-Phenyl indole. (J) Quantification of the expression of overall NRF2 in (I). (K) Quantification of the ratio of NRF2 in the nucleus to NRF2 in the cytoplasm in (I). Data represent means ± SEM. * p < 0.05, ** p < 0.01, and *** p < 0.001 vs. control (CTRL) mice. Data are from the kidneys of three (A–E) or six mice (F–I).

