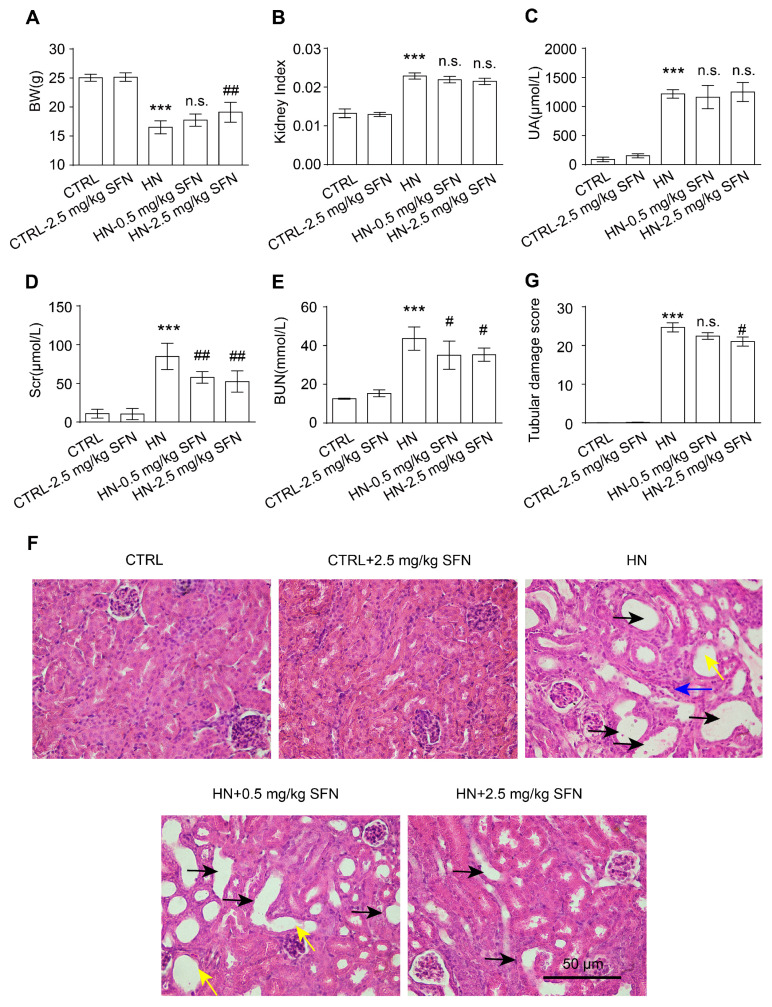
Figure 4.
Activation of NRF2 improves kidney injury in HN mice. (A) Body weight (BW) in the indicated groups. (B) Kidney index (kidney weight–to–body weight ratios) in the indicated groups. (C) UA in the indicated groups. (D) Scr in the indicated groups. (E) BUN in the indicated groups. (F) Hematoxylin and eosin staining of kidney tissue. Black arrows represent dilation, blue arrows represent atrophy, and yellow arrows represent loss of brush borders. Scale bar, 50 μm. (G) Quantification of tubular injury score in mouse kidney sections. Data represent means ± SEM. *** p < 0.001 vs. control (CTRL) mice. # p < 0.05 and ## p < 0.01 vs. hyperuricemia nephropathy (HN) mice. n.s. = no significance. Data are from the kidneys of six mice.

