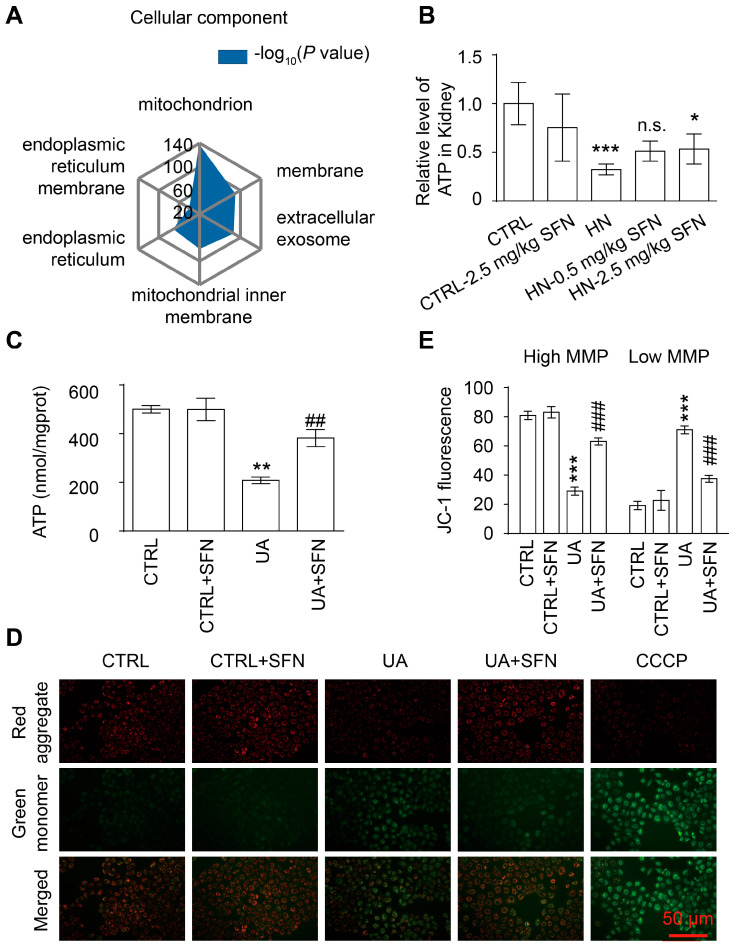
Figure 5.
Activation of NRF2 ameliorates renal and cellular mitochondrial dysfunction in animal and cell models. (A) Gene ontology (GO) enrichment analysis of downregulated genes. (B) ATP levels in the kidneys in the indicated groups. (C) ATP levels of cells in cells in the indicated groups. (D) Representative images of MMP with the JC-1 staining of cells in the indicated groups, observed under a fluorescence microscope at 20× magnification. Carbonyl cyanide m-chlorophenyl hydrazine (CCCP) as positive control. Scale bar, 50 μm. (E) The ratio of JC-1 green and red fluorescence. Data represent means ± SEM. * p < 0.05, ** p < 0.01 and *** p < 0.001 vs. control (CTRL) group. ## p < 0.01, and ### p < 0.001 vs. hyperuricemia nephropathy (HN) group and uric acid (UA) group. n.s. = no significance. Data are from the kidneys of six mice, or data are from six replicate experiments.

