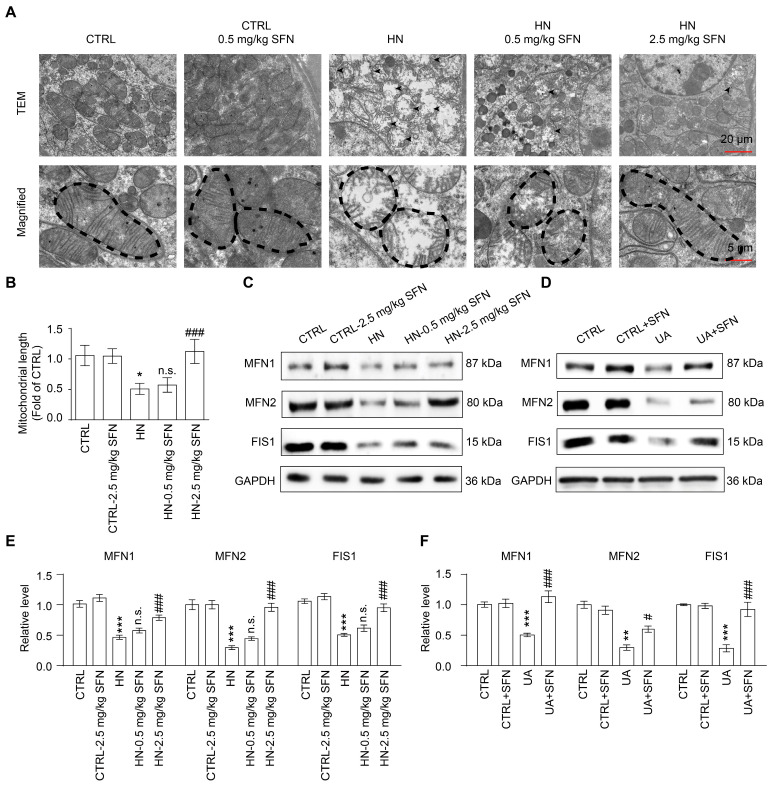
Figure 6.
Activation of NRF2 restores renal and cellular mitochondrial homeostasis in animal and cell models. (A) Representative TEM images of mitochondria in the proximal tubular epithelial cells of HN mice, scale bar, 20 µm. (B) Quantification of the mitochondrial length detected by TEM. (C) Western blots of MFN1, MFN2, and FIS1 in the kidneys in the indicated groups, and the quantitative analysis of MFN1, MFN2, and FIS1 expression. (D) Western blots of MFN1, MFN2, and FIS1 in cells in the indicated groups. (E) The quantitative analysis of MFN1, MFN2, and FIS1 expression in (C). (F) The quantitative analysis of MFN1, MFN2, and FIS1 expression in (D). Data represent means ± SEM. * p < 0.05, ** p < 0.01 and *** p < 0.001 vs. control (CTRL) group. # p < 0.05 and ### p < 0.001 vs. hyperuricemia nephropathy (HN) group and uric acid (UA) group. n.s. = no significance. Data are from kidneys of six mice, or data are from six replicate experiments.

