Figure 7.
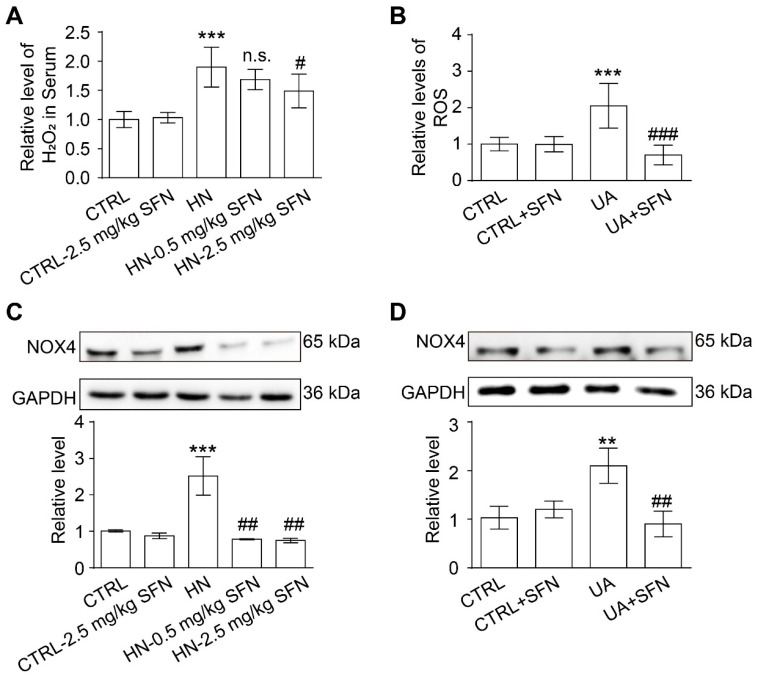
Activation of NRF2 relieves kidney and cellular oxidative stress in animal and cell models. (A) The level of H2O2 in the serum of mice in the indicated groups. (B) Quantitative analysis of ROS levels in cells in the indicated groups. (C) Western blot of NOX4 in the kidneys of mice in the indicated groups, and the quantitative analysis of NOX4 expression. (D) Western blot of NOX4 in cells in the indicated groups, and the quantitative analysis of NOX4 expression. Data represent means ± SEM. ** p < 0.01 and *** p < 0.001 vs. control (CTRL) group. # p < 0.05, ## p < 0.01, and ### p < 0.001 vs. hyperuricemia nephropathy (HN) group and uric acid (UA) group. n.s. = no significance. Data are from the kidneys of six mice, or data are from six replicate experiments.

