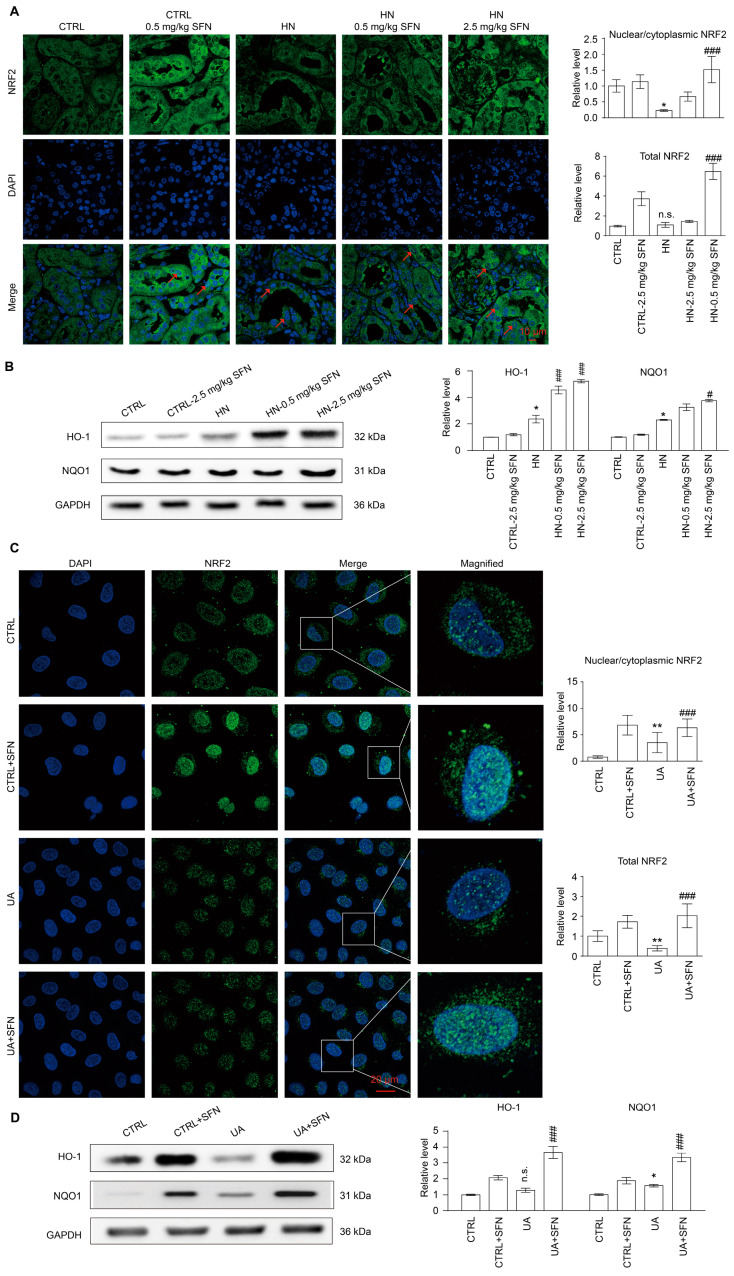
Figure 8.
Activation of NRF2 enhances the antioxidant capacity of HN mouse kidneys and cells. (A) Immunofluorescence staining of NRF2 in kidneys in the indicated groups, the quantification of the expression of overall NRF2 in (A), and the quantification of the ratio of NRF2 in the nucleus to NRF2 in the cytoplasm in (A). Scale bar, 10 μm. (B) Western blots of HO-1 and NQO1 in the kidneys in the indicated groups, and the quantitative analysis of the expression of HO-1 and NQO1. (C) Immunofluorescence staining of NRF2 in cells in the indicated groups, the quantification of the expression of overall NRF2 in (C), and the quantification of the ratio of NRF2 in the nucleus to NRF2 in the cytoplasm in (C). The inset shows a higher magnification of the rectangular area. Scale bar, 20 μm. (D) Western blots of HO-1 and NQO1 in the cells in the indicated groups, and the quantitative analysis of the expression of HO-1 and NQO1. Red arrows indicate NRF2 nuclear localization. DAPI, 4’,6-diamidino-2-Phenyl indole. Data represent means ± SEM. * p < 0.05 and ** p < 0.01 vs. control (CTRL) group. # p < 0.05 and ### p < 0.001 vs. hyperuricemia nephropathy (HN) group and uric acid (UA) group. n.s. = no significance. Data are from the kidneys of six mice, or data are from six replicate experiments.

