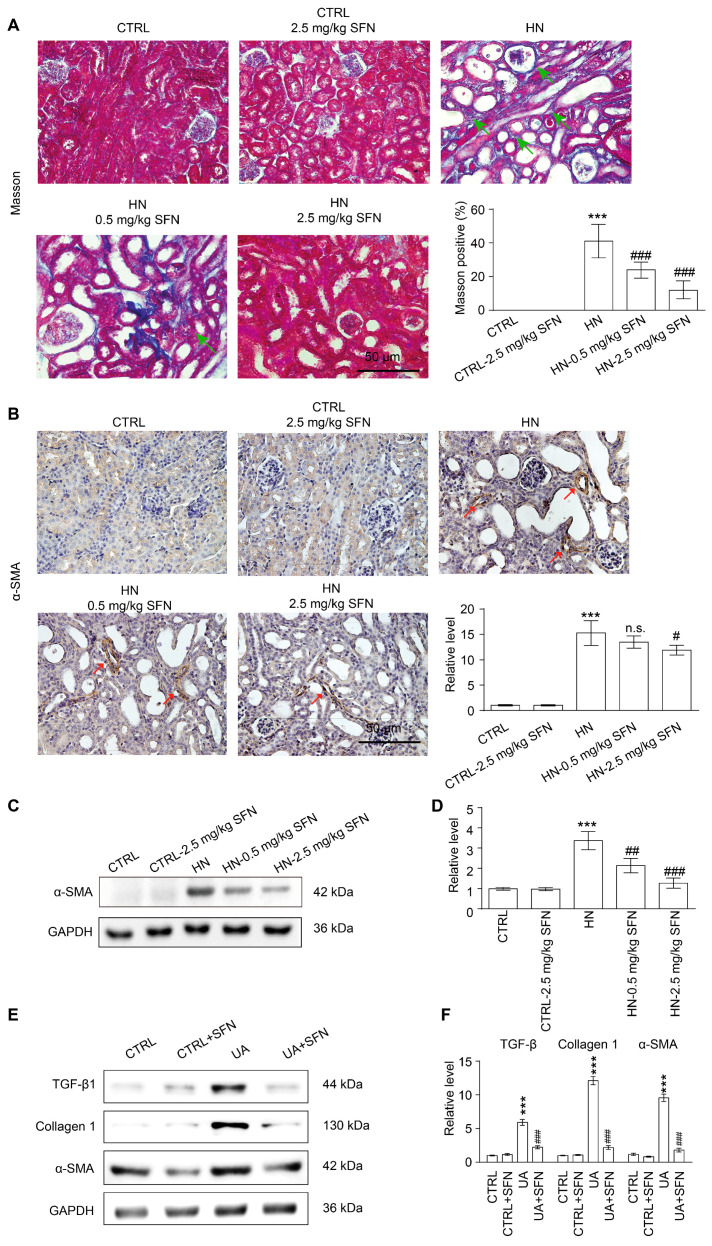
Figure 9.
Activation of NRF2 ameliorates renal fibrosis in animal and cell models. (A) Masson staining of kidney tissue and the quantification of Masson-stained positive areas in mouse kidney sections, green arrows represent collagen deposits that are stained blue. Scale bar, 50 μm. (B) Immunohistochemical staining of α-SMA in kidneys in the indicated groups, red arrows represent α-SMA-positive areas. Scale bar, 50 μm. (C) Western blot of α-SMA in the kidneys in the indicated groups. (D) Quantitative analysis of α-SMA expression in (C). (E) Western blots of TGF-β1, collagen 1, and α-SMA in the indicated groups. (F) Quantitative analysis of the expression of TGF-β1, collagen 1, and α-SMA in (E). Data represent means ± SEM. *** p < 0.001 vs. control (CTRL) group. # p < 0.05, ## p < 0.01 and ### p < 0.001 vs. hyperuricemia nephropathy (HN) group and uric acid (UA) group. n.s. = no significance. Data are from the kidneys of six mice, or data are from six replicate experiments.

