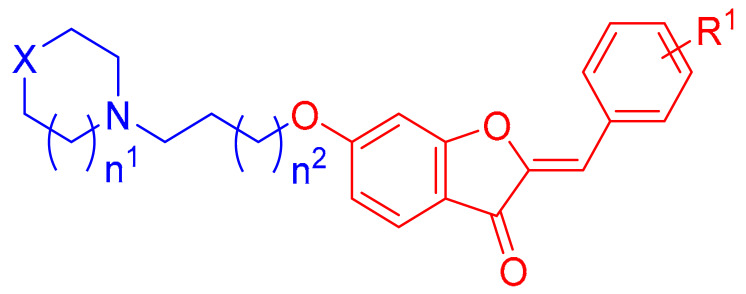
Table 2.
IC50 values for MAO-A, MAO-B, and AChE as well as MAO-B inhibition selectivity indices for the most promising compounds.
| Compound | X | n1 | n2 | R1 | MAO-A | MAO-B | MAO-B Selectivity Index | AChE IC50 (µM) 3 | |
|---|---|---|---|---|---|---|---|---|---|
| % Inhibition 1 | IC50 (µM) 2 | IC50 (µM) 2 | |||||||
| 3aa | No atoms | 1 | 0 | 2′-methoxy | 27.18 ± 2.94 | >100 | 0.96 ± 0.004 | >104 | 2.67 ± 0.05 |
| 3al | CH2 | 0 | 2 | 4′-methoxy | 14.89 ± 3.46 | >100 | 8.65 ± 0.196 | >12 | 1.42 ± 0.09 |
| 3ap | CH2 | 1 | 0 | 3′,4′-dimethoxy | 22.52 ± 0.04 | >100 | 10.18 ± 0.099 | >9.8 | 0.40 ± 0.03 [30] |
| 3ax | CH2 | 0 | 0 | 2′,5′-dimethoxy | 27.70 ± 4.95 | >100 | 3.16 ± 0.036 | >32 | 1.49 ± 0.31 [30] |
| 3bc | CH2 | 0 | 0 | 3′,4′,5′-trimethoxy | 21.37 ± 3.51 | >100 | 0.34 ± 0.002 | >289 | 1.56 ± 0.07 [30] |
| Safinamide | ND | ND | 0.11 ± 0.004 | ND | — | ||||
| Clorgyline | 100.49 ± 0.03 | 0.005 ± 0.0002 | ND | ND | — | ||||
| Galantamine | ND | ND | ND | ND | 4.69 ± 0.12 [30] | ||||
1 Percent inhibition (±sem values) of MAO-A activity at a single dose concentration of 100 µM., 2 IC50: Concentration (±sem values) of the synthesized compound expressed in µM value that inhibits 50% of MAO-A/MAO-B activity., 3 IC50: Concentration (±SD values) of the synthesized compound expressed in µM value that inhibits 50% of AChE activity.

