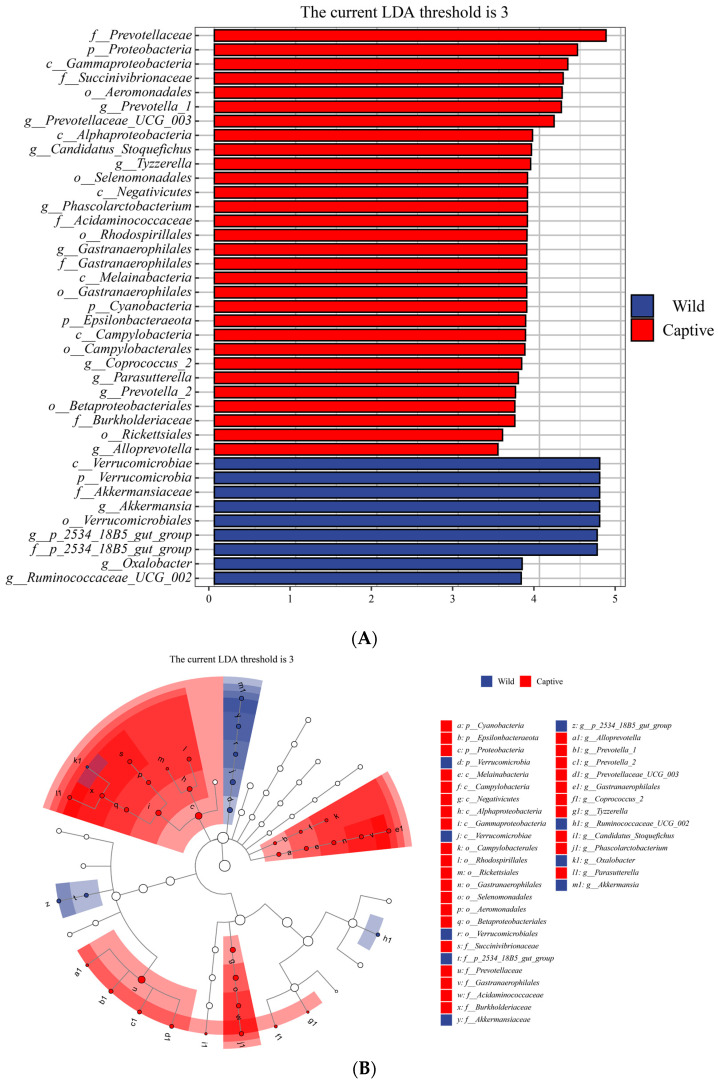
Figure 5.
Using the LEfSe analysis to identify the bacterial taxa with significant differences between the two groups. The cladogram shows the evolutionary clades of different species. The circles radiating from the inside to the outside represent the taxonomic level from phylum to genus. Each small circle at a different taxonomic level represents a taxonomy at that level, and the diameter of the circles is proportional to the relative abundance. Red nodes represent microbial groups that play an important role in the captive group, blue nodes represent microbial groups that play an important role in the wild group, and yellow nodes mean no significant difference (A). Bacterial taxa with a significant difference and an LDA score greater than the estimated value (3.0); the histogram length represents the LDA score (B).

