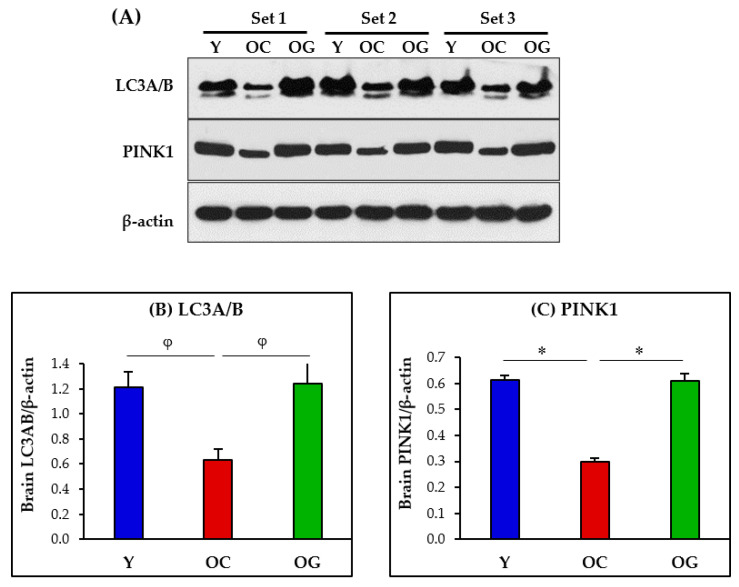
Figure 8.
(A) Immunoblots for protein expression for LC3A/B and PINK1. Each blot represents 3 sets from the brains of young mice (Y), old-control mice (OC) and old mice on GlyNAC supplementation (OG). PINK1 = PTEN-induced kinase 1; LC3A/B = Light chain 3 microtubule associated proteins 1A/1B. (B,C) Immunoblot quantification: optical density of protein expression was normalized to the loading control (β-actin). ∗ = p < 0.05; φ = p < 0.01.

