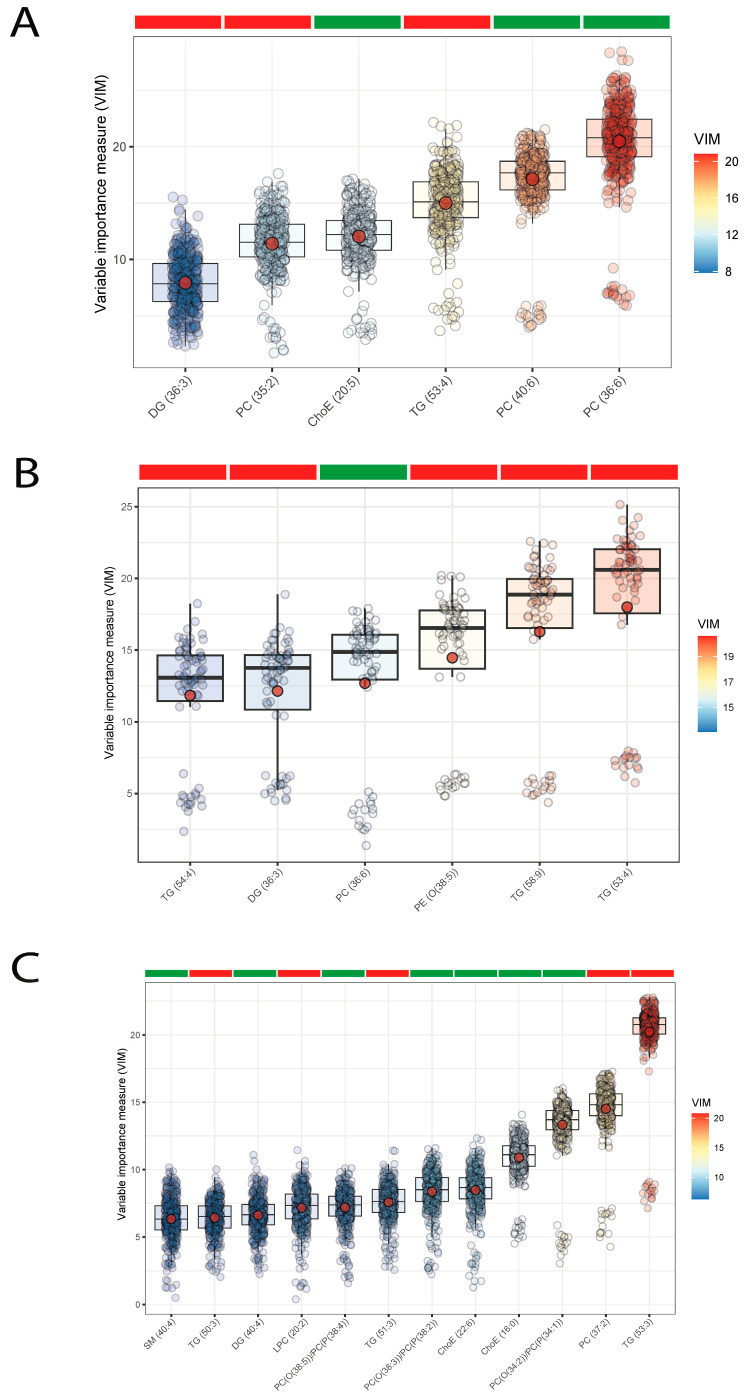
Figure 2.
Boxplots of normalized variable importance (VIM) for the lipid species associated with the carotid intima-media thickness (IMT). The red dot represents the mean, and the color bar below the plot indicates the sign of the association, with red indicating negative correlation and green positive correlation. (A) In all subjects; (B) in subjects with overweight/obesity (BMI ≥ 25 kg/m2); (C) in subjects without overweight/obesity (BMI < 25 kg/m2). ChoE, cholesterol ester; DG, diglyceride; LPC, lysophosphatidylcholine; PC, phosphatidylcholine; PC(O), alkyl-ether-phosphatidylcholine; PC(P), alkenyl-ether-phosphatidylcholine (plasmalogen); PE, phosphatidylethanolamine; SM, sphingomyelin; TG, triglyceride.

