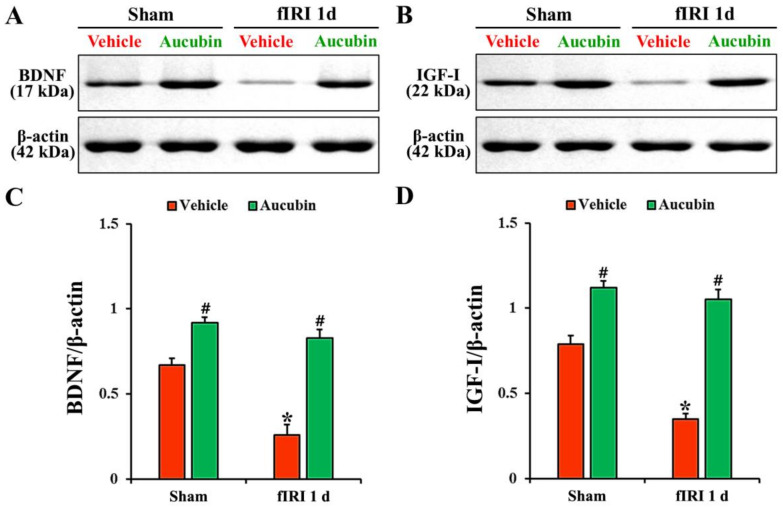
Figure 7.
(A,B) Representative Western blot images of BDNF and IGF-I in the CA1 area of the vehicle-sham, vehicle-fIRI, aucubin-sham, and aucubin-fIRI groups 1 day after fIRI. In the vehicle-fIRI group, BDNF and IGF-I levels are significantly reduced when compared with those found in the vehicle-sham groups. In the aucubin-sham and aucubin-fIRI groups, BDNF and IGF-I levels are significantly higher than those observed in the vehicle-sham groups. (C,D) Quantitative analyses of BDNF and IGF-I levels by normalization to β-actin level, respectively. Values are expressed in mean ± SEM (n = 5, respectively; * p < 0.05 vs. each sham group, # p < 0.05 vs. vehicle-fIRI group).

