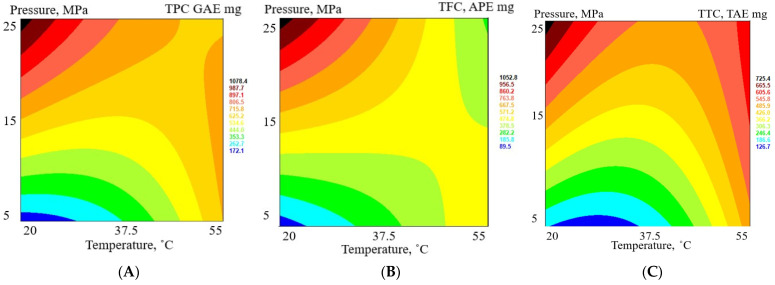
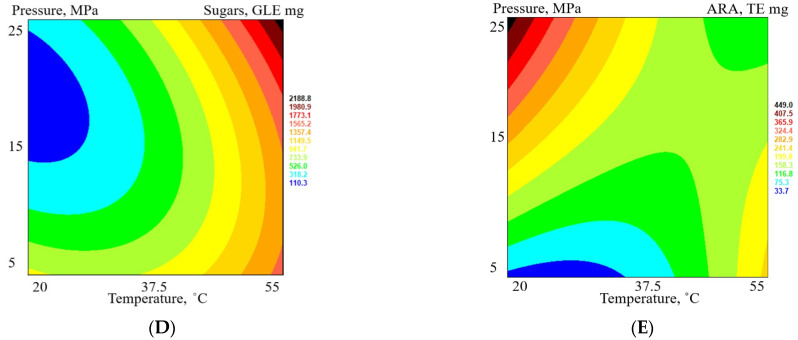
Figure 3.
Response surface plots as a function of pressure (MPa) and temperature (°C): (A)—total phenolic content, expressed as gallic acid equivalents (GAE mg); (B)—total flavonoid content, expressed as apigenin equivalents (APE mg); (C)—total tannin content, expressed as tannic acid equivalents (TAE mg); (D)—total sugar content, expressed as glucose equivalents (GE mg); and (E)—radical scavenging activity, expressed as trolox equivalents (TE mg).


