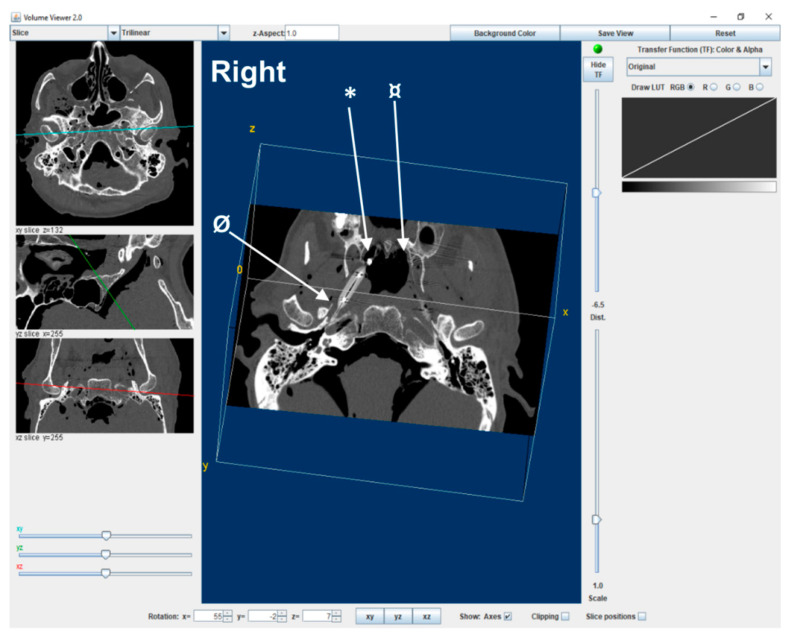
Figure 1.
Example of 3D volume viewing of a CT image in ImageJ software under the guidance of anatomical landmarks (* medial pterygoid plate spine, ¤ opposite medial pterygoid plate spine, and Ø sphenoid spine) and an inflated balloon to determine the ET longitudinal axis coordinates at the center as a starting point of image analysis. The X, Y, and Z coordinates of the image on the right are demonstrated on the smaller images on the left side as blue line (top), green line (middle image), and red line (bottom image).

