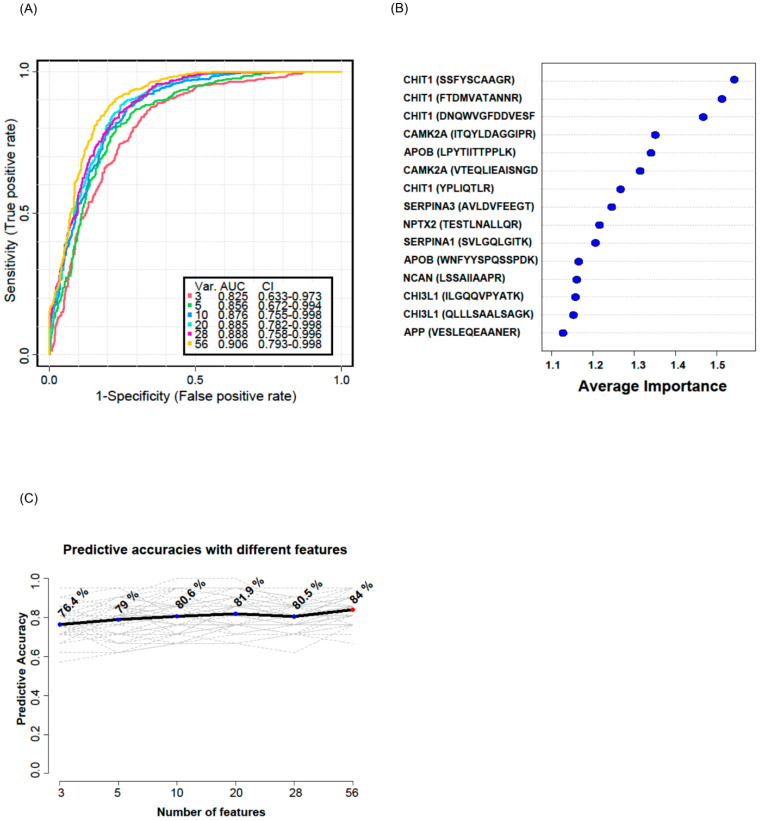
Figure 6.
Multivariate ROC analysis and predictive accuracy. Multivariate ROC analyses were conducted using different numbers of features ranging from 3 to 56. Var. indicates the number of features used. CI indicates confidence interval (A). The top 15 significant features affecting the discrimination of ALS from HC are shown with their average importance (B). The accuracy for predicting ALS as the number of features increased is shown (C).

