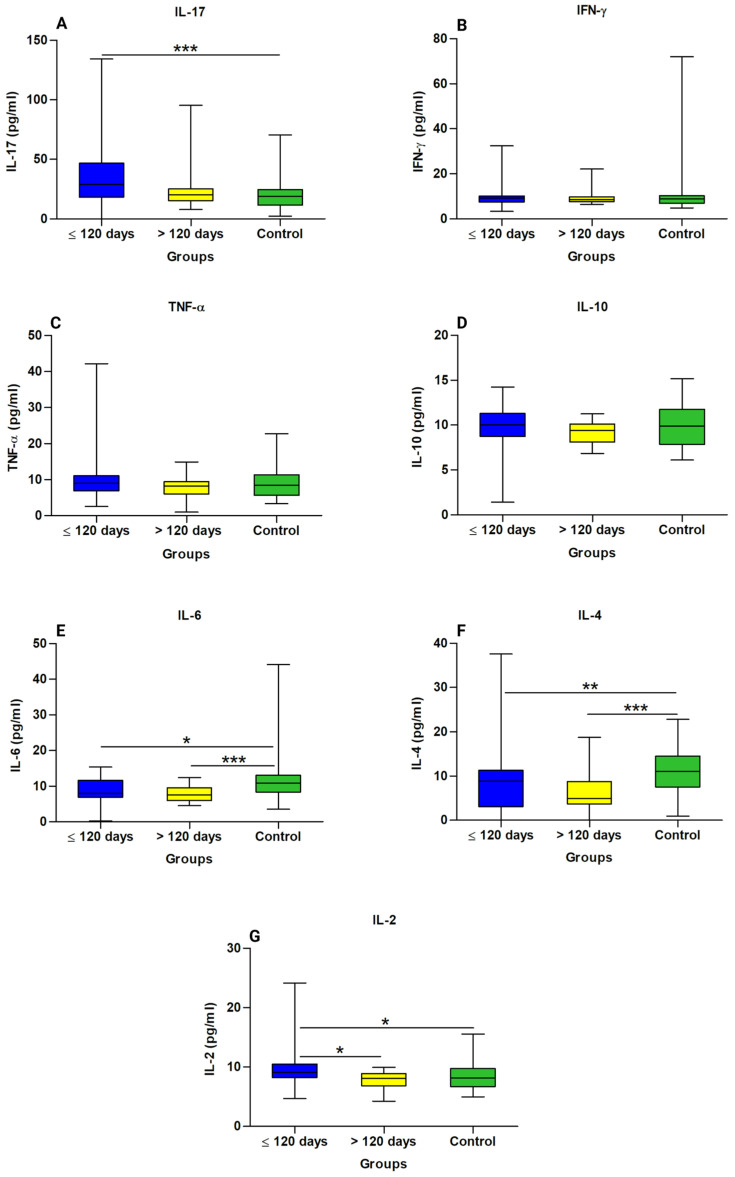
Figure 3.
Comparison of cytokine levels in the long COVID subgroups and controls. (A) IL-17 Interleukin 17, (B) IFN-γ interferon gamma, (C) TNF-α tumor necrosis factor alpha, (D) IL-10 interleukin 10, (E) IL-6 interleukin 6, (F) IL-4 interleukin 4, and (G) IL-2 interleukin 2. * Statistically significant if p < 0.05 (* p < 0.05, ** p < 0.01 and *** p < 0.001), Kruskal–Wallis with Dunn’s post hoc test (nonparametric). pg/mL: Picogram per millilitre.

