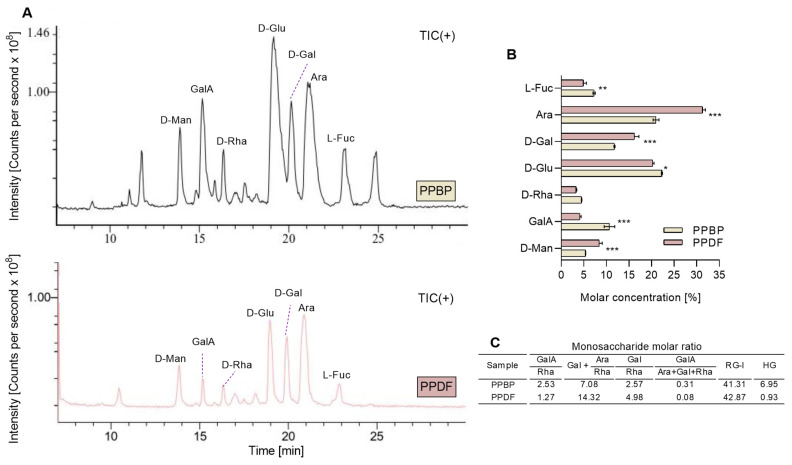
Figure 4.
The monosaccharide profile chromatograms of persimmon pulp by-product (PPBP) and persimmon pulp dietary fibre (PPDF) (A). The molar concentration of monosaccharides in PPBP and PPDF samples (B). The molar ratios of monosaccharides found in PPBP and PPDF (C). Where the homogalacturonan, HG = GalA − Rha, and the rhamnogalacturonan, RG-I = 2 × Rha + Ara + Gal. A higher molar concentration of Ara, D-Gal, and D-Man was found in PPDF than in PPBP (*** p < 0.001, ** p < 0.01, * p < 0.05; Student’s t-test). Values are expressed as mean (n = 3) ± standard deviation (SD).

