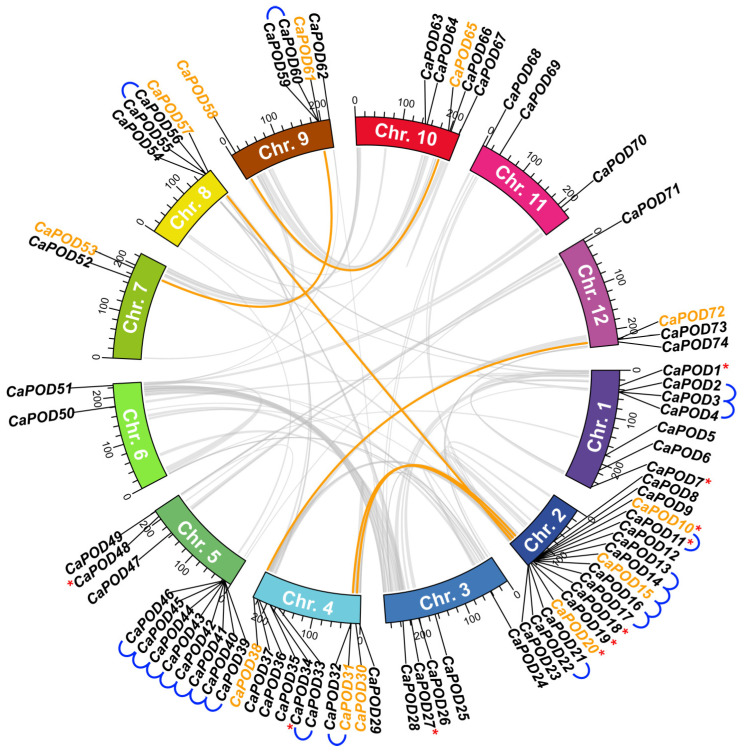
Figure 2.
Synteny analysis of CaPOD genes. Pepper chromosomes (Chr. 1–12) are represented in different colors. Grey curved lines within the scheme refer to the co-localization of genetic loci in the pepper genome. Collinear relationships between CaPOD genes are drawn in orange. Tandem duplication for CaPOD genes is indicated with blue lines. Red asterisks indicate those CaPOD genes identified in the transcriptome of sweet pepper fruit.

