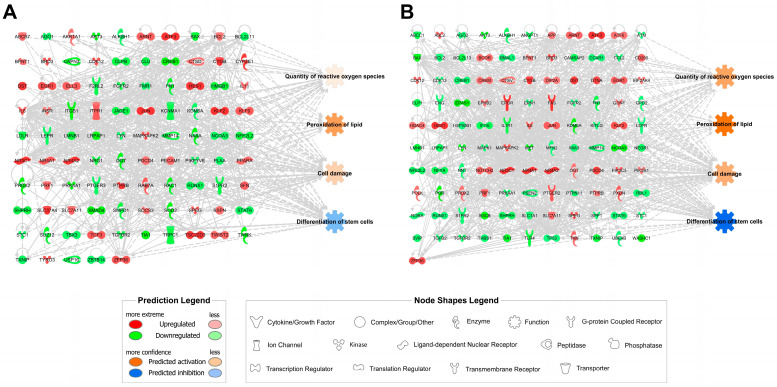
Figure 2.
Transcriptomic networks with prediction using ingenuity pathway analysis. (A) Transcriptomic network in PBS-stored hBM-MSCs for 6 h; (B) Transcriptomic network in PBS-stored hBM-MSCs for 12 h. The fold change cut-off value used in the analysis for the networks is ±1.5 based on a previous report [58]. Upregulated genes are represented in red while the downregulated genes are in green. Orange and blue indicate the predicted activation and inhibition of cellular functions, respectively. Solid and dotted lines show direct and indirect relationships, respectively.

