Figure 6.
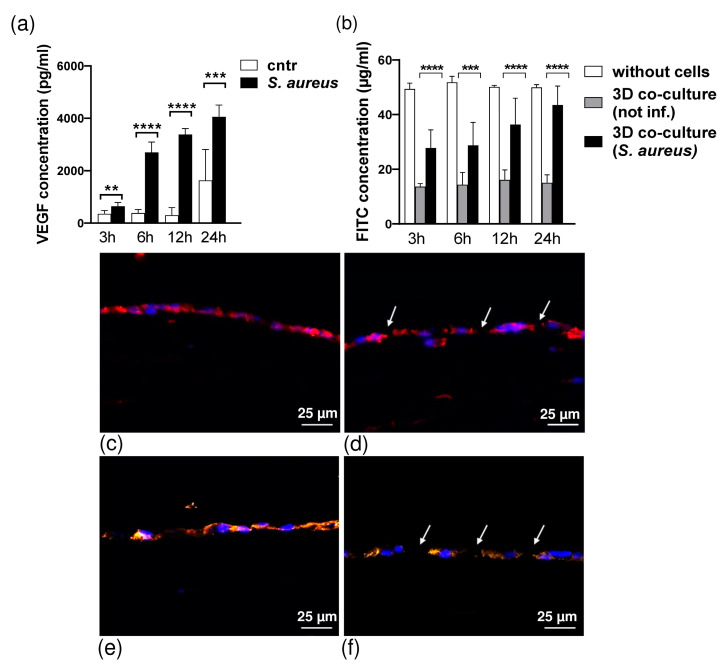
(a). S. aureus activated 3D co-culture model of pleura release of VEGF. The 3D co-culture model of pleura was incubated in SFM or stimulated with S. aureus in time-dependent response with 1 × 10⁶ CFU/mL bacteria concentration. The values are means 7 SE of four separate experiments. Statistical analysis was conducted using t-test (n = 7). Statistical significance ** p = 0.002, *** p = 0.003 and **** p < 0.0001 compared with control. (b) Permeability measurement using FITC-dextran assay. Permeability was measured by FITC-dextran (70 kDa) assay at 3 h, 6 h, 12 h, and 24 h incubation with S. aureus. The horizontal axis shows the fluorescence intensity of FITC-conjugated dextran leaking from the upper to the lower chambers of transwell membranes measured in each lower chamber 3 h after adding a molecular marker. The graph shows fluorescence intensity from the lower compartment. White, gray, and black bars indicate control (transwell, no cells seeded), 3D co-culture model of pleura not infected, and 3D tissue infected with 106 CFU/mL of S. aureus, respectively. Error bars indicate SE (mean ± SEM; n = 8); *** p = 0.007, **** p < 0.0001 Student’s t-test. This figure is representative of three independent experiments. (c–f) Effect of S. aureus infection on junctional localization of VE-cadherin and ZO-1 proteins. Immunocytochemistry of VE-cadherin (c and d) and ZO-1 (e,f) on 3D co-culture model of pleura with or without S. aureus infection. Uninfected control 3D co-culture (c,e): VE-cadherin and ZO-1 staining clearly outline cell membranes of untreated HPMCs. At 3 h after incubation with S. aureus (d,f), the VE-cadherin and ZO-1 staining pattern is fragmented with disruption in VE-cadherin and ZO-1 continuity and incomplete appearance at the points of multiple cell contacts ((d,f) arrows). Controls where primary antibody has been omitted do not show any unspecific binding (data not included). Anti VE-cadherin (red), anti ZO-1 (orange), and DAPI (blue).

