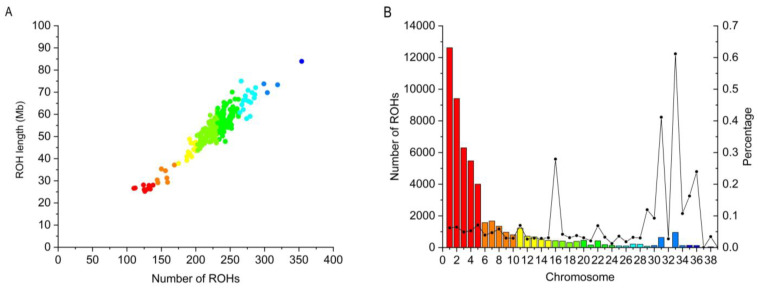
Figure 2.
The distribution of ROH detected in Wenchang chicken across autosomes. (A) Length distribution of ROH. The x-axis represents the number of ROH, and the y-axis represents the length of ROH (Mb). (B) Number and coverage of the ROH. The bars and the lines represent the number of ROH and ROH coverage, respectively, on each chromosome.

