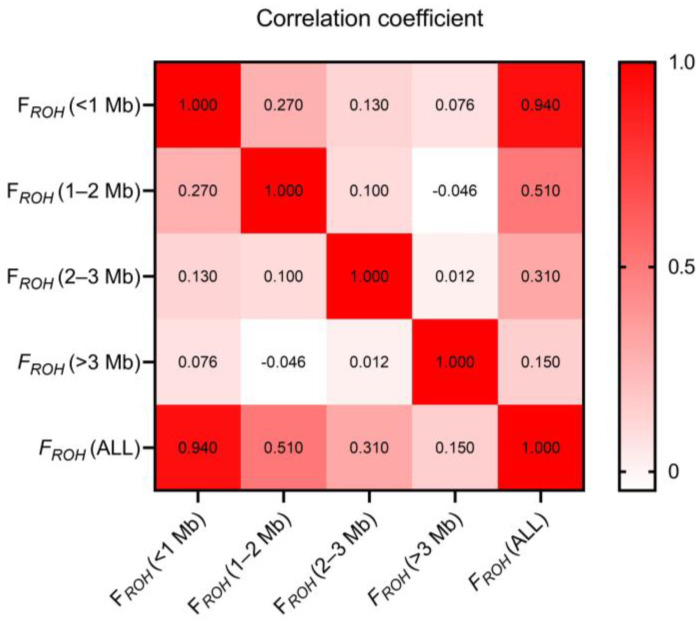
Figure 3.
Correlation of genomic inbreeding coefficients calculated based on different length ROH fragments (FROH (<1 Mb), FROH (1–2 Mb), FROH (2–3 Mb), FROH (>3 Mb), and FROH (All)). The darker the color, the higher the correlation of the data. The t-test of all the data shows that the p-value between the data is less than 0.01.

