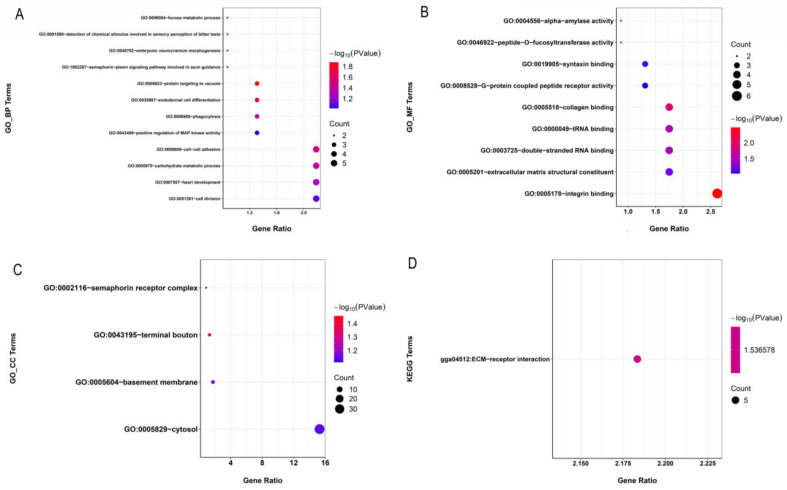
Figure 5.
Enrichment analysis of the variants located in gene exons. The significantly enriched GO terms (p < 0.05) are classified as a biological process (BP, A), cellular component (CC, B), or molecular function (MF, C). The significantly enriched KEGG pathways (p < 0.05) are shown in (D). The size of each circle represents the number of genes in each GO term or pathway, and the color represents the p-value of each GO term or pathway.

