Figure 1.
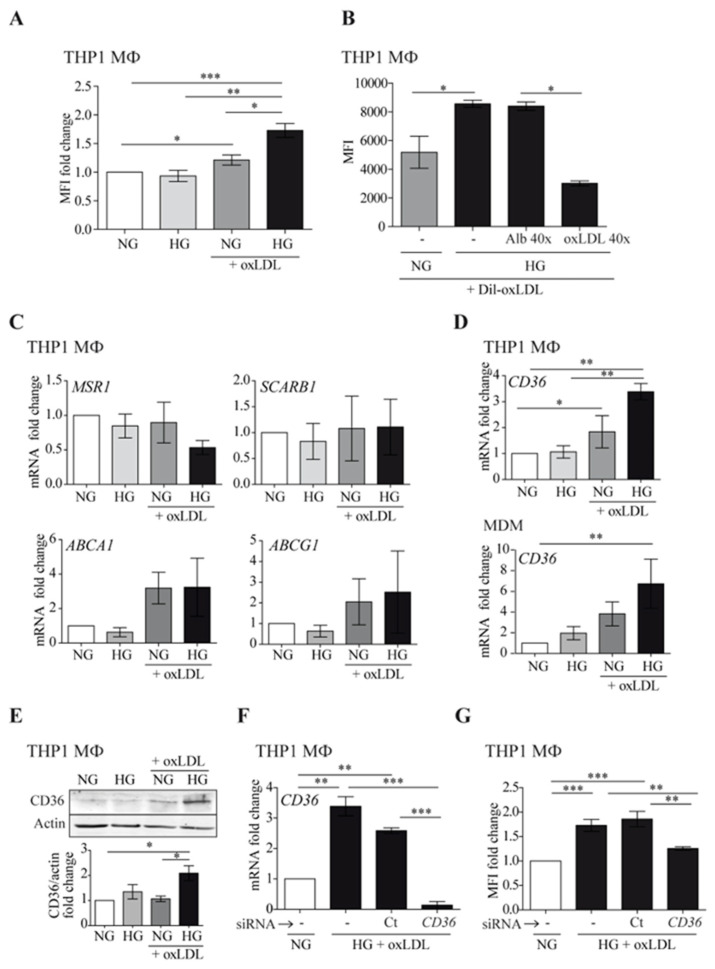
High glucose potentiates macrophage oxLDL uptake through CD36 upregulation. Cells were treated with 150 μg/mL of oxLDL for 24 h in culture medium with 5 mmol/L (normal glucose, NG) or 15 mmol/L (high glucose, HG) of glucose. (A) THP1 MΦ were fixed and stained with Nile Red, and the lipid content was analyzed by flow cytometry. Data show the mean fluorescence intensity (MFI) fold change from 5 independent experiments relative to untreated cells (NG) ± SEM. (B) THP1 MΦ were incubated for 6 h with fluorescent Dil-oxLDL, and oxLDL uptake was analyzed by flow cytometry. Excess human albumin (Alb 40×) was used as a negative competition control and excess oxLDL as a specific competition control (oxLDL 40×). The graph shows MFI values ± SEM from 5 independent experiments. (C,D) The amount of mRNA encoding MSR1, SCARB1, ABCA1, ABCG1 (C), and CD36 (D) was measured by RT-PCR, and the data show the mean fold change relative to untreated cells (NG) ± SEM from at least 3 independent experiments. (E) THP1 MΦ were lysed and probed by Western blotting with an antibody specific to CD36. Upper panel: Western blot image of a representative experiment. Lower panel: mean protein signal intensity fold change relative to untreated cells (NG) ± SEM from 3 independent experiments. Equal loading was determined by probing against actin. (F,G) THP1 cells were left untreated (-), transfected with siRNA targeting CD36 (CD36), or transfected with a non-targeting negative control (Ct), and incubated with oxLDL under HG conditions for 24 h. CD36 expression was analyzed by RT-PCR (F) and lipid content by Nile Red staining and flow cytometry (G). Mean values ± SEM from at least 3 independent experiments are shown (* p < 0.05, ** p < 0.01, *** p < 0.001, Mann–Whitney test). MDM: monocyte-derived macrophages.

