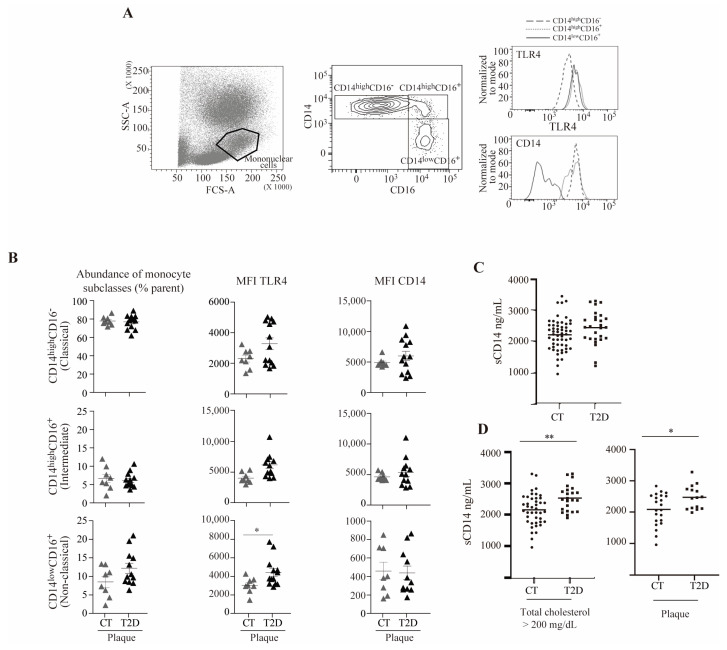
Figure 6.
TLR4 and sCD14 are elevated in a subset of non-classical monocytes from subjects with T2D and atherosclerosis and in T2D subjects with hypercholesterolemia or atherosclerosis, respectively. (A) Representative plots of the total blood flow cytometry gating strategy: (left) forward scatter (FCS-A) and side scatter (SSC-A) showing the mononuclear cell population, (center) monocyte expression pattern of CD14 and CD16 showing the classical (CD14highCD16−), intermediate (CD14highCD16+), and non-classical (CD14lowCD16+) subclasses, and (right) TLR4 and CD14 fluorescence histograms. (B) Abundance of monocyte subclasses, and TLR4 and CD14 mean fluorescence intensity (MFI) in the control (CT) and diabetic group (T2D) in the presence of subclinical atherosclerosis (plaque). (C) sCD14 plasma levels as measured by ELISA from subjects with and without diabetes. (D) sCD14 plasma levels as measured by ELISA from subjects with hypercholesterolemia (total cholesterol > 200 mg/dL) with and without diabetes (left) and from subjects with atherosclerosis with and without diabetes (right) (* p < 0.05, ** p < 0.01, Mann–Whitney test).

