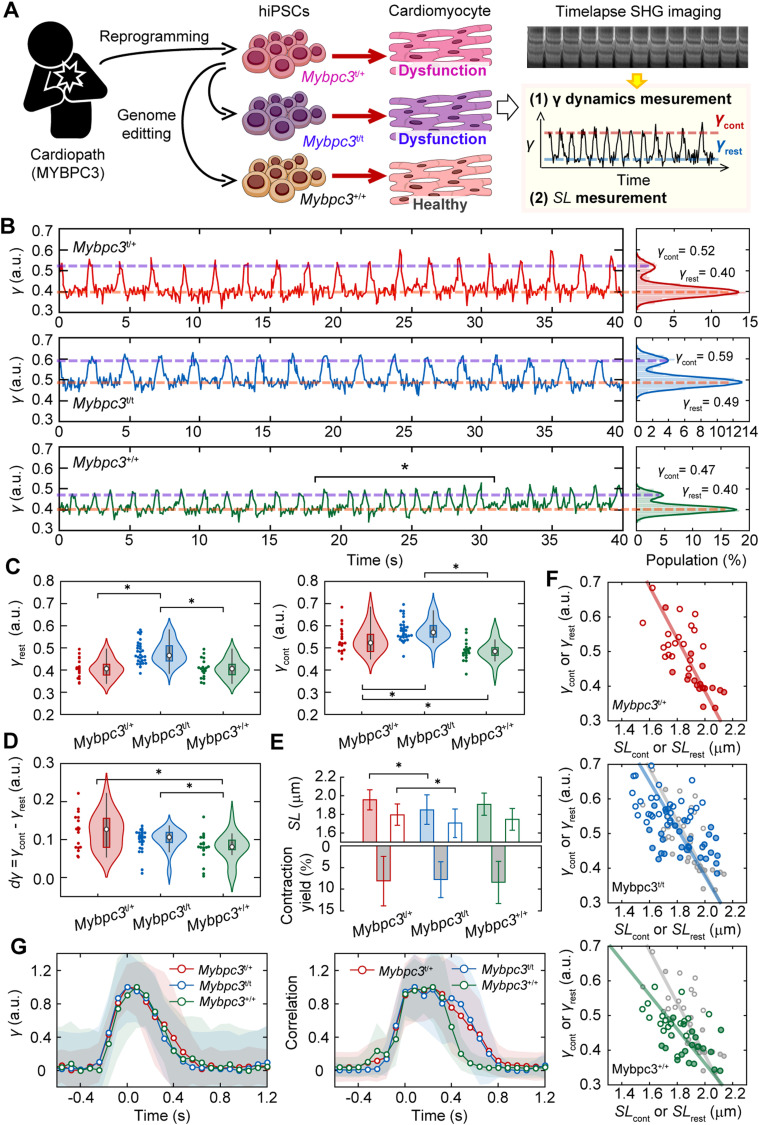
Figure 5. SHG anisotropy measurement of cardiomyocytes differentiated from genetic disease patient-derived hiPSCs.
(A) A schematic drawing of the experimental procedure. (B) A typical example of dynamic measurement of the sarcomere movement of parameter γ with 80 ms time resolution in Mybpc3t/+ (top), Mybpc3t/t (middle), and Mybpc3+/+ cells (bottom). Right panels are histograms of γ-value in each trace. Solid lines in the right panels are fitting results with double Gaussian distributions. Magenta lines indicate γcont and orange lines indicate γrest in each trace obtained by the fitting. Asterisk indicates the occasional change of the beating cycle. (C) Violin plots of γrest (left) and γcont (right) for Mybpc3t/+ (red, N = 21 FOVs), Mybpc3t/t (blue, N = 36), and Mybpc3+/+ (green, N = 28). (D) Violin plots of dγave = γcont - γrest in Mybpc3t/+ (red, N = 21), Mybpc3t/t (blue, N = 36), and Mybpc3+/+ (green, N = 28). (E) Bar graphs of SL in the resting state (filled) and in the contracting state (opened) (upper) and contraction yield (lower). Error bars are SD. (F) Relationship between SLrest or SLcont and γrest or γcont for Mybpc3t/+ (top), Mybpc3t/t (middle) and Mybpc3+/+ (bottom). Filled and opened marks are for the resting state and for the contracting state, respectively. Solid line is a line linked between averaged value of data for the resting state and for the contracting state. Overlapped gray marks and line in middle and bottom panels are those for Mybpc3t/+. (G) Averaged time courses of γ-value (left) and sarcomere motion (right) and average trace of a pulsation in all analyzable data for Mybpc3t/+ cell (red, N = 8), Mybpc3t/t cell (blue, N = 13), and Mybpc3+/+ cell (green, N = 6). Light colors are SD. (C, D, E) Asterisks in (C, D, E) indicate less than 0.01 of the P-value in the t test.

