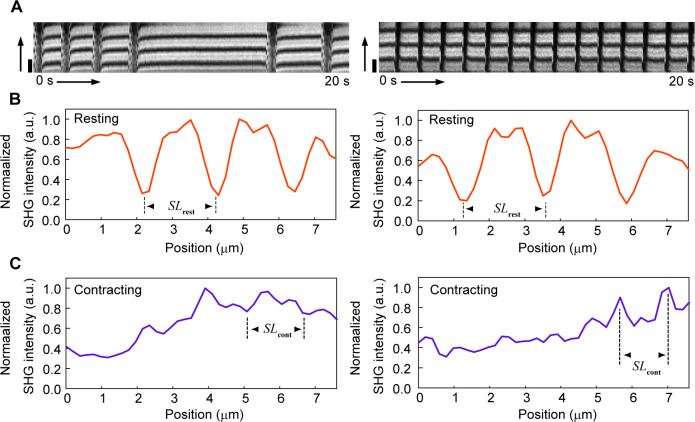
Figure S3. Examples of measurement of sarcomere length SL during myocardial contraction.
(A) Two typical examples of kymograph indicating dynamic change of SHG intensity distribution along the myofibril axis in hiPSC-derived cardiomyocytes in the case that the image contrast has remarkable decrease by defocusing because of muscle contraction. The vertical axis is the myofibril axis and the horizontal axis is the elapsed time. Scale bar, 2 μm. (B, C) Line profiles along the myofibril axis of the averaged images within the resting state (B) or within the contracting state (C). When living cardiomyocytes are the object of observation, such as in this study, a sarcomere is occasionally out of the confocal position because of muscle contraction, causing the degradation of SHG intensity during measurement. Periodicity of a sarcomere could be confirmed by averaging, even in images with such the low contrast ratio, enabling measurement of SLcont.

