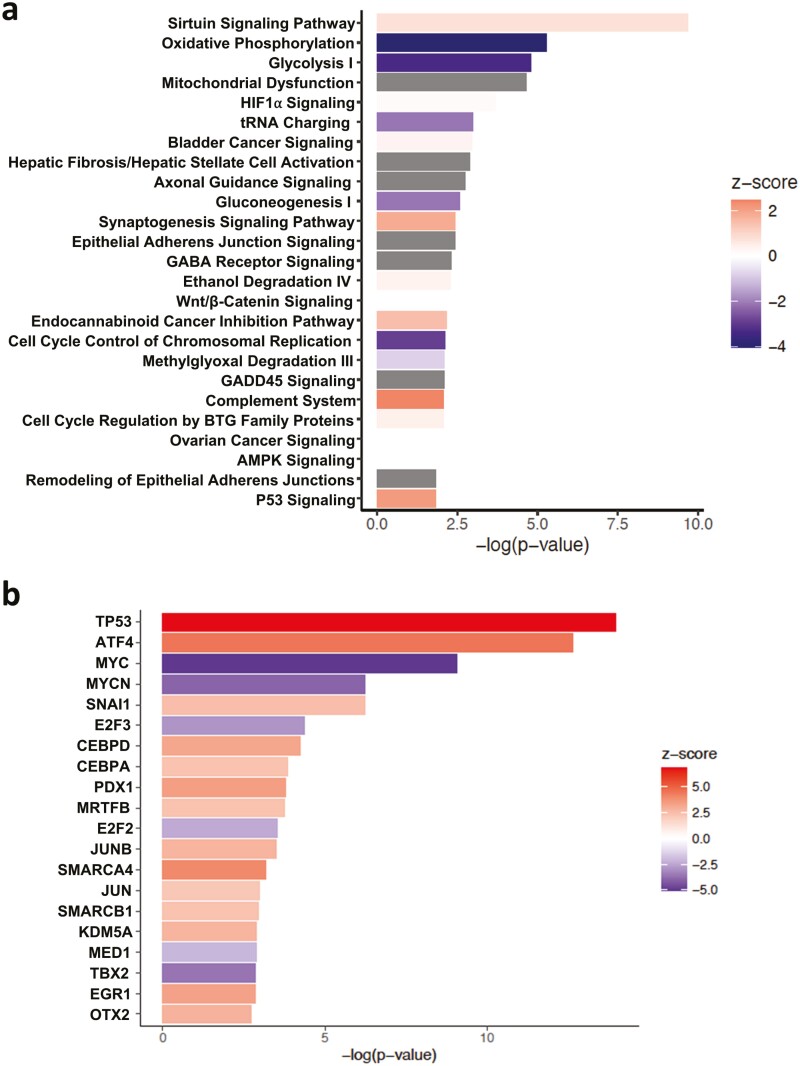
Figure 2.
IPA of transcriptomic changes in DCF-treated TE11 cells. TE11 cells were treated with 200 µm DCF for 48 h then subjected to transcriptomic profiling by RNA-Sequencing. IPA predicted changes in canonical pathways in (a) and transcriptional regulators in (b). IPA ranking of top canonical pathways and transcription factors is based on −log(P-value). IPA predicted activation state is based on z-score with positive value indicating activation and negative value indicating inhibition of respective pathways. No activation state is available for the canonical pathways with gray colored bar.

