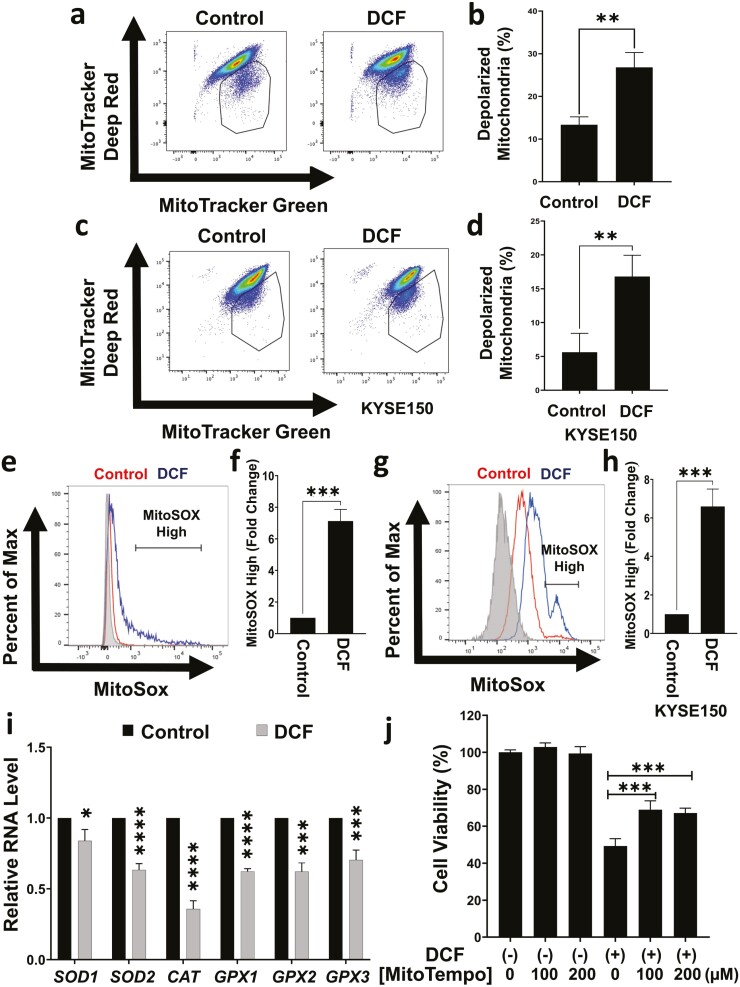
Figure 4.
DCF induces mitochondrial membrane depolarization and mitochondrial ROS production in TE11 and KYSE150 cells. TE11 or KYSE150 cells were treated with for 48 h with 200 or 400 µM DCF, respectively. (a–d) Flow cytometry assessed mitochondrial membrane potential using MitoTracker Deep Red (membrane potential sensitive dye) and MitoTracker Green (membrane potential insensitive dye). Representative dot plot with gate indicating depolarized mitochondria in (a, c) and bar diagram summarizing data from three independent experiments in (b, d). (e–h) Flow cytometry assessed mitochondrial superoxide using MitoSOX. Representative dot plot with gate indicating MitoSOX-high fraction in (e, g) and bar diagram summarizing data from three independent experiments in (f, h). (i) RNA level of indicated antioxidant genes was evaluated in TE11 cells by qPCR relative to vehicle-treated control cells. upon treatment with DCF. (j) Prior to addition of DCF, TE11 cells were pretreated the ROS scavenger MitoTempo for 24 h cells. Data in (b, d, f, h, i) shown as mean ± SD relative to vehicle-treated cells; *P < 0.05; **P < 0.01; *** P < 0.005; ****P< 0.001 by t-test; n = 3. Data in (j) shown as mean ± SD; ***P < 0.005 by ANOVA with Tukey’s post hoc test; n = 3.

