Figure 6.
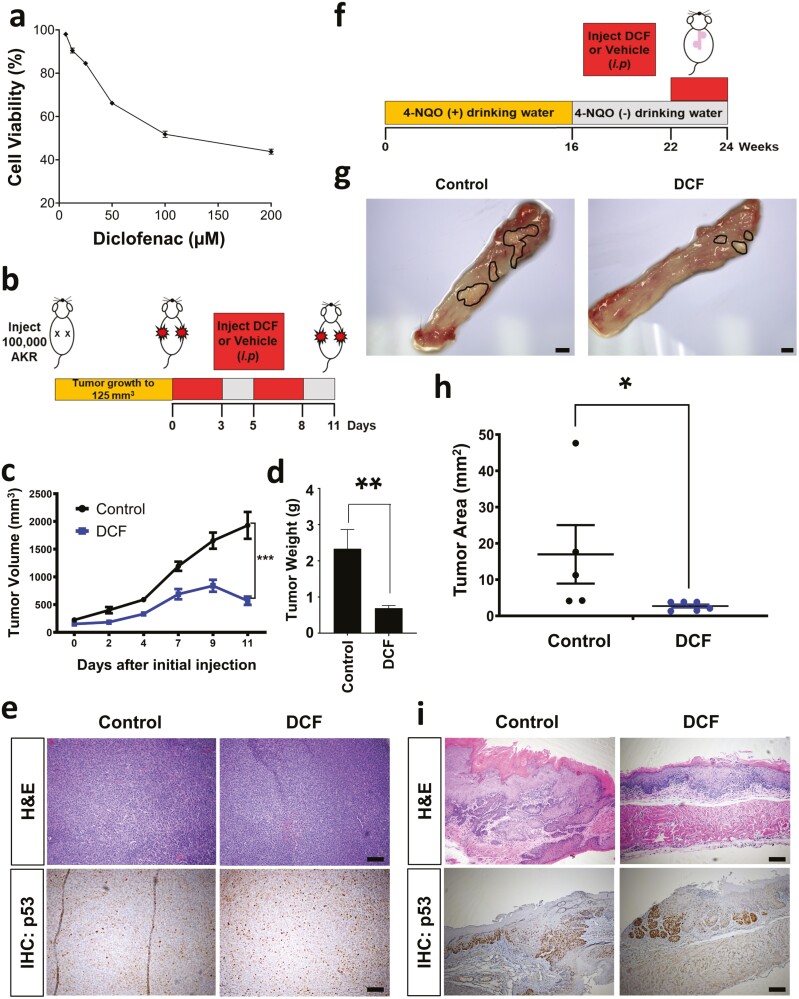
DCF inhibits ESCC in vivo. (a) Cell viability was measured by MTT assay in murine ESCC cell line AKR treated with DCF at indicated doses for 72 h. Dose–response curve is shown ±SD; n = 3. (b) Schematic overview of experimental design for syngenetic transplantation. (c–e) AKR cells were transplanted into C57Black6 mice. Once tumors reached ~125 mm3 mice were administered DCF (15 mg/kg) or vehicle (7% DMSO) by i.p. injection according to a 3 days on/2 days off regimen for 11 days. Tumor volume is shown in (c) and tumor weight is shown in (d). Data shown in (c, d) as mean ± SEM; *P < 0.05; **P < 0.01 by t-test; n = 5 tumors from DCF-treated mice; n = 5 tumors from vehicle-treated mice. (e) Representative brightfield images of H&E or p53 IHC staining in histological tissue sections. Scale bars, 100 µm. (f) Schematic overview of experimental design for 4-NQO-mediated ESCC model. (g–i) C57Black6 mice were administered 4-NQO (100 µg/ml) for 16 weeks via drinking water. 4-NQO was then withdrawn for a period of 6 weeks. Starting at week 22, mice were subjected to i.p. injection of DCF (15 mg/kg) or vehicle (7% DMSO) according to a 3 days on/2 days off regimen for 2 weeks. (g) Representative brightfield images of macroscopic mouse esophagus. Tumors are outlined in black. Scale bars, 1 mm. (h) Quantification of tumor burden was measured using images in (g). Data shown as mean ± SEM; *P < 0.05 by t-test; n = 6 DCF-treated mice; n = 5 vehicle-treated mice. (f) Representative brightfield images of H&E or p53 IHC staining in histological tissue sections. Scale bars, 100 µm.

