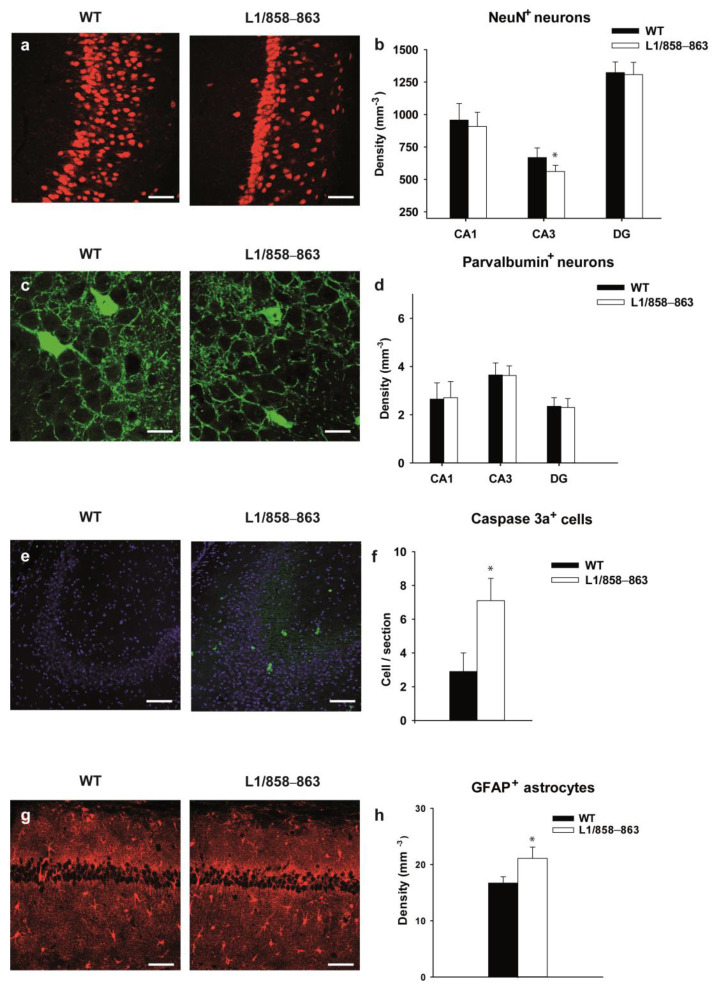
Figure 8.
Histological analyses of male and female mutant and WT hippocampus. (a) Representative images of the NeuN-stained CA3 subfield. Scale bars, 50 µm. (b) Mean + SD of the densities of NeuN+ neurons in the CA1, CA3 and DG. Asterisk indicates a significant difference (p < 0.05; t-test, n = 6 mice per genotype). (c) Representative images of parvalbumin-stained interneurons in the CA3 subfield. Scale bars, 20 µm. (d) Mean + SD of the densities of parvalbumin+ neurons in the CA1, CA3 and DG. There was no significant difference between genotypes (p > 0.05; t-test, n = 6 mice per genotype). (e) Representative images of activated caspase-3a-stained (green) CA3 subfield. Scale bars, 50 µm. Cell nuclei are counterstained with DAPI (blue). (f) Mean + SD of the number of caspase 3a+ cells per section. Asterisk indicates a significant difference (p < 0.05; Mann–Whitney test, n = 6 mice per genotype). (g) Representative images of glial fibrillary acidic protein (GFAP)-immunostained hippocampus. Scale bars, 50 µm. (h) Mean + SD of the densities of GFAP+ astrocytes in the hippocampus. Asterisk indicates a significant difference (* p < 0.05; t-test, n = 6 mice per genotype).

