Figure 3.
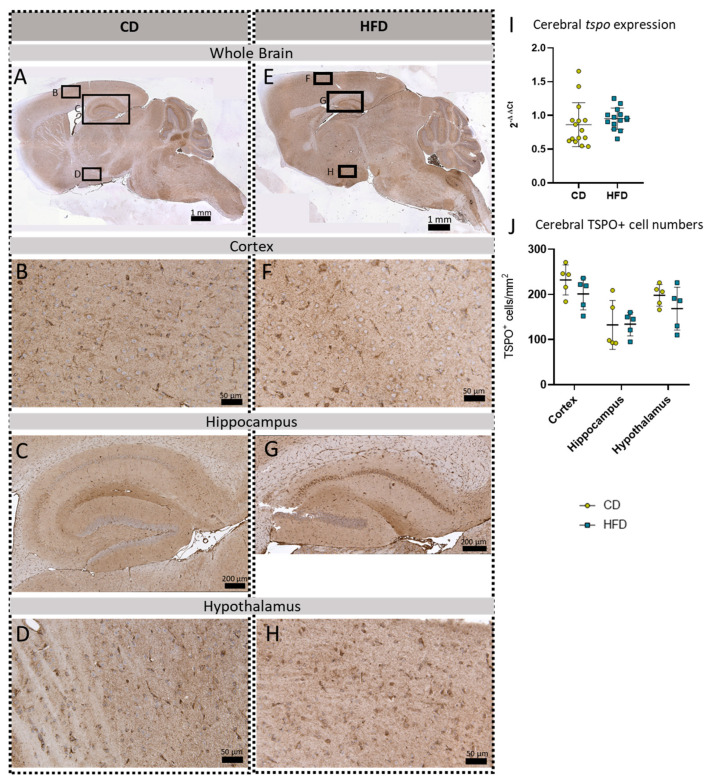
Immunohistochemical TSPO reactions in sagittal brain sections of mice after long-term (24 weeks) control diet (CD, n = 5) or high-fat diet (HFD, n = 5) within designated regions of interest (Figure B–D,F–H) defined by black rectangles in overview images (Figure A,E). (A) Overview of a representative sagittal TSPO-reacted brain slice of the CD group with indicated regions for detailed images; scale bar: 1 mm. (B) Detailed image of TSPO-reacted cortex of the CD group; scale bar: 50 µm. (C) Detailed image of the TSPO-reacted hippocampus of the CD group; scale bar: 200 µm. (D) Detailed image of the TSPO-reacted hypothalamus of the CD group; scale bar: 50 µm. (E) Overview of a representative sagittal TSPO-reacted brain slice of the HFD group with indicated regions for detailed images; scale bar: 1 mm. (F) Detailed image of the TSPO-reacted cortex of the HFD group; scale bar: 50 µm. (G) Detailed image of the TSPO-reacted hippocampus of the HFD group; scale bar: 200 µm. (H) Detailed image of the TSPO-stained hypothalamus of the HFD group; scale bar: 50 µm. (I) 2−ΔΔCT values representing relative mRNA expression of tspo in the brains of CD (n = 15) vs. HFD (n = 14) group. Data presented as group mean ± standard deviation. Statistical analysis by Mann–Whitney test, p = 0.267. (J) Mean cell numbers of TSPO+ cells/mm2 in the cortex, hippocampus and hypothalamus of CD vs. HFD groups. Data presented as group mean ± standard deviation. Statistical analysis by repeated measures ANOVA with post hoc tests without corrections for multiple comparisons; cortex: p = 0.1905, hippocampus: p = 0.9546, hypothalamus: p = 0.2638.

